Fig. 7.
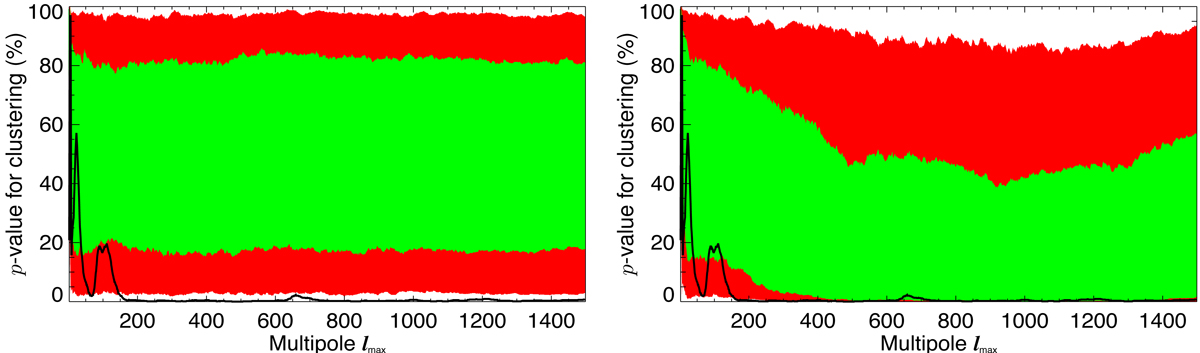
p-values for alignment of the spatial power distribution dipoles up to a given multipole. This is the equivalent plot to Fig. 36 in Planck Collaboration XVI (2016). The green and red bands indicate the 1σ and 2σ spread of p-values measured in 1000 Gaussian simulat ions (left panel) and 1000 non-Gaussian model simulations (right panel). The black line corresponds to the p-values for Planck data taken from Fig. 36 in Planck Collaboration XVI (2016). These p-values show the percentage of Gaussian simulations with a larger alignment of the spatial power distribution up to the given multipole (calibrated with 1000 Gaussian simulations).
Current usage metrics show cumulative count of Article Views (full-text article views including HTML views, PDF and ePub downloads, according to the available data) and Abstracts Views on Vision4Press platform.
Data correspond to usage on the plateform after 2015. The current usage metrics is available 48-96 hours after online publication and is updated daily on week days.
Initial download of the metrics may take a while.