Fig. 3.
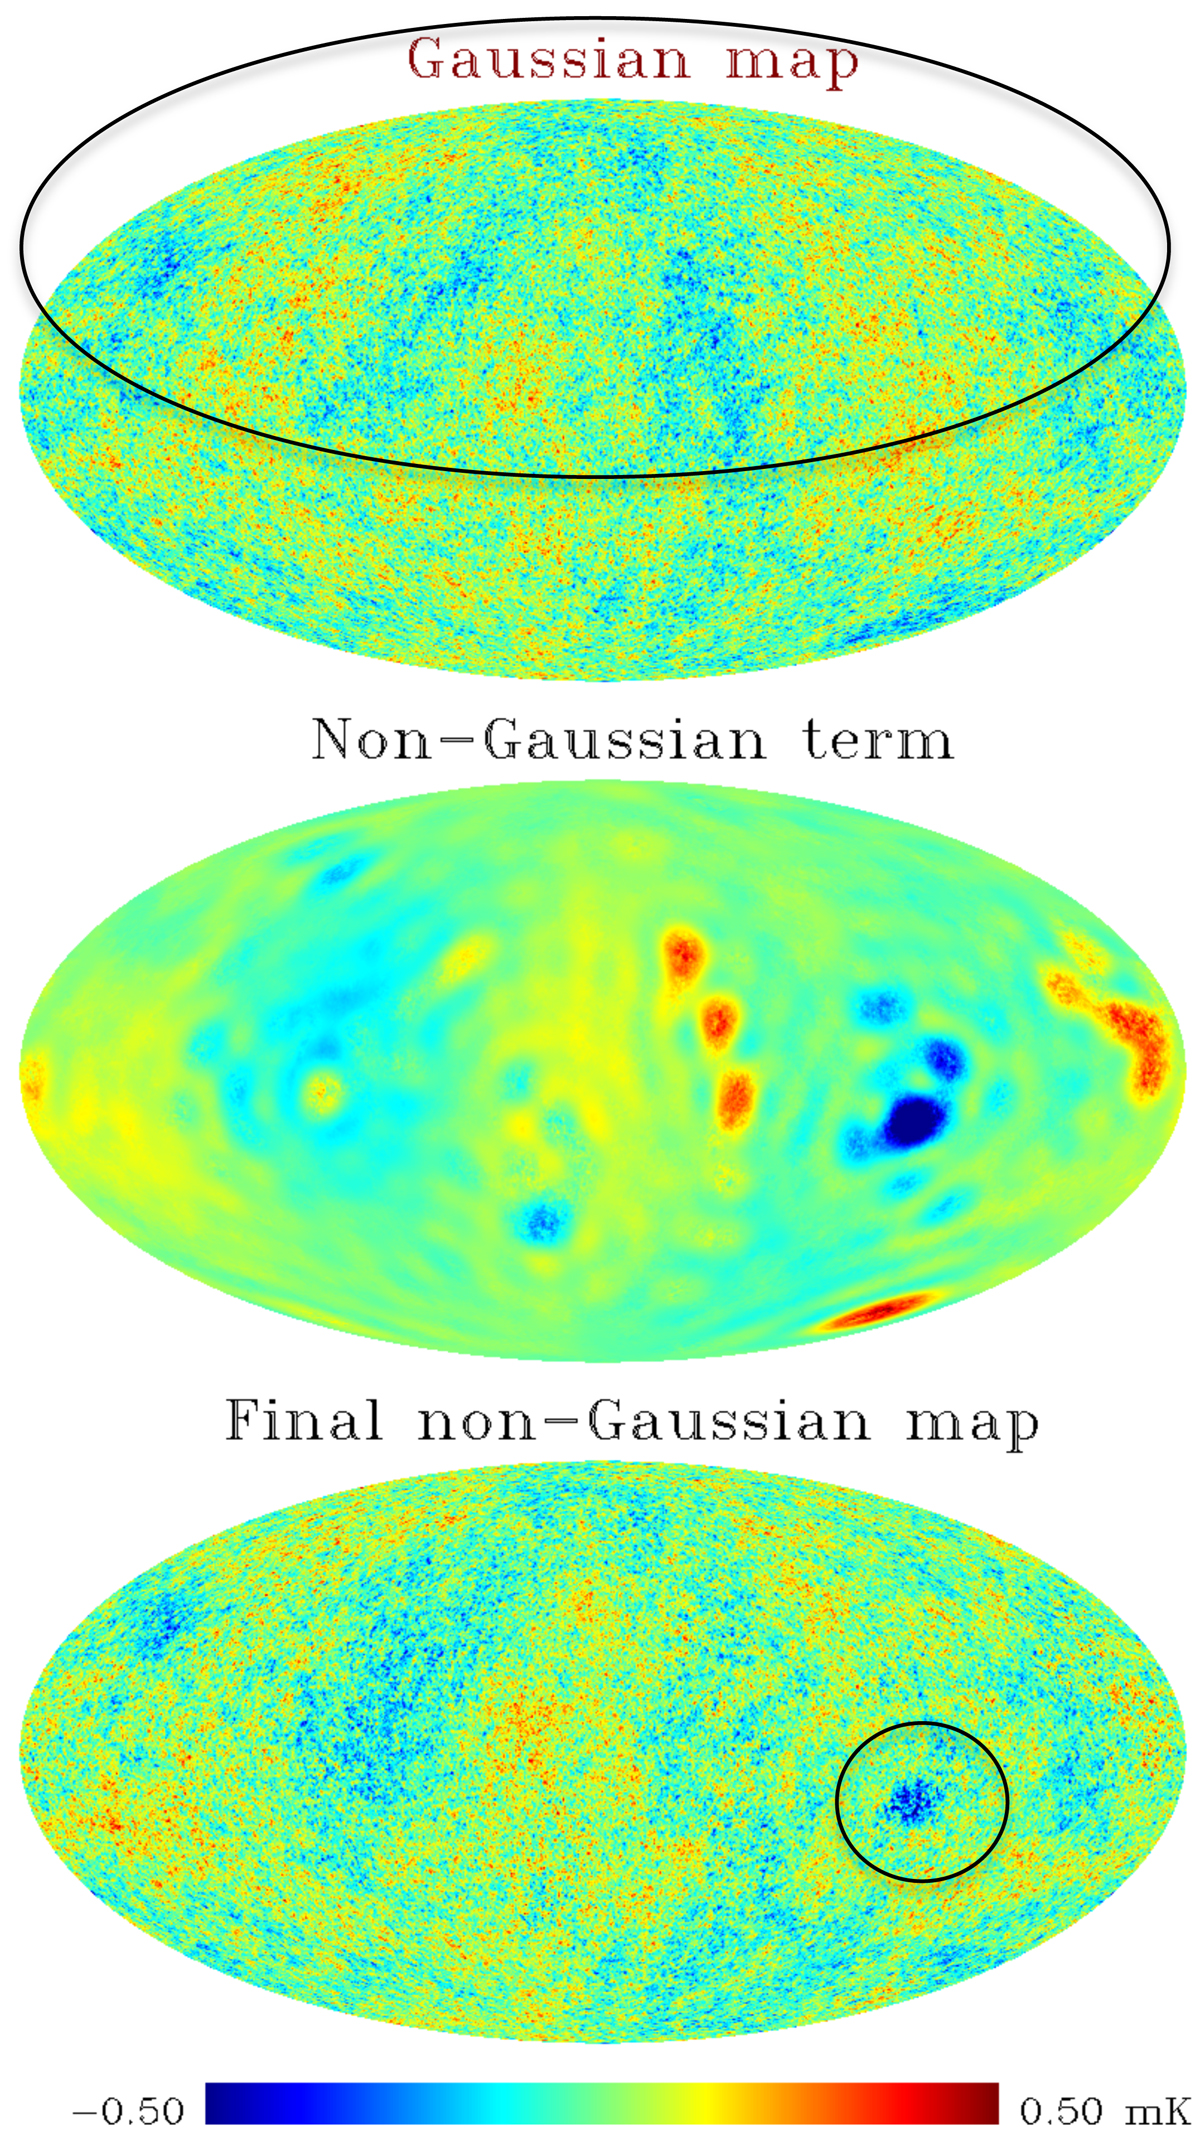
Top: original simulated Gaussian map. The circle indicates the hemisphere with the most large-scale power. Middle: additional term used in our non-Gaussian model scaled by βdimensionless = 4.4 × 10⁶, as used for the simulated model. Bottom: non-Gaussian map created by the addition of the second map to the Gaussian map. The circle highlights a cold spot surrounded by a hot ring.
Current usage metrics show cumulative count of Article Views (full-text article views including HTML views, PDF and ePub downloads, according to the available data) and Abstracts Views on Vision4Press platform.
Data correspond to usage on the plateform after 2015. The current usage metrics is available 48-96 hours after online publication and is updated daily on week days.
Initial download of the metrics may take a while.