Free Access
Fig. 10.
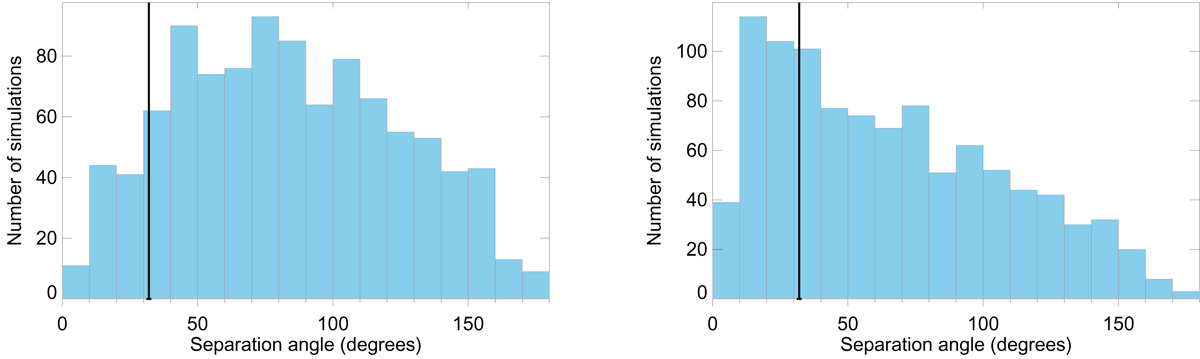
Angular distance between hot or cold spot and direction of max dipolar modulation. The distribution of the angular distance is shown for 1000 Gaussian simulations (left panel) and 1000 non-Gaussian simulations (rights panel). The vertical black line corresponds to the angular distance for the Planck data.
Current usage metrics show cumulative count of Article Views (full-text article views including HTML views, PDF and ePub downloads, according to the available data) and Abstracts Views on Vision4Press platform.
Data correspond to usage on the plateform after 2015. The current usage metrics is available 48-96 hours after online publication and is updated daily on week days.
Initial download of the metrics may take a while.