Fig. 1.
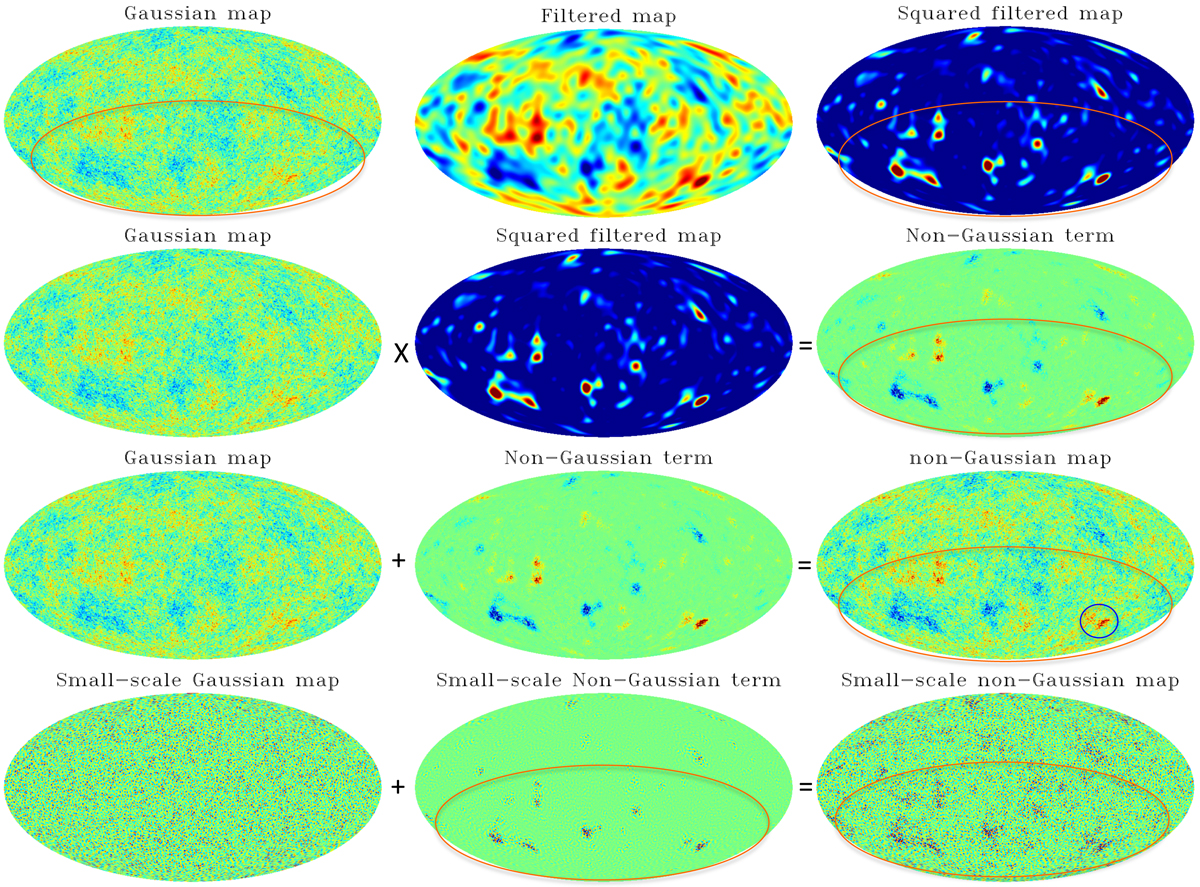
First row: Gaussian CMB realisation (left), the filtered version (middle), and the square of the filtered map (right). The orange ellipse denotes the random dipole direction observed on large angular scales. For the squared map, dark blue corresponds to zero temperature, while for all other maps dark red and dark blue correspond to the largest negative and positive fluctuations in the map. Second row: product of the Gaussian map (left) and the squared filtered map (middle) generates the non-Gaussian contribution (right) that enhances the dipole in the power distribution. Third row: combination of the original Gaussian map (left) and the non-Gaussian term (middle) scaled by the factor βdimensionless = 1.77 × 10⁸ yielding a non-Gaussian map (right) with enhanced dipole modulation and a hot spot with excess kurtosis shown in the blue circle. Last row: as in the third row, but for scales ℓ = 100−200 only. The value of β is exaggerated here in order to make the effect visible by eye.
Current usage metrics show cumulative count of Article Views (full-text article views including HTML views, PDF and ePub downloads, according to the available data) and Abstracts Views on Vision4Press platform.
Data correspond to usage on the plateform after 2015. The current usage metrics is available 48-96 hours after online publication and is updated daily on week days.
Initial download of the metrics may take a while.