Free Access
Fig. 7
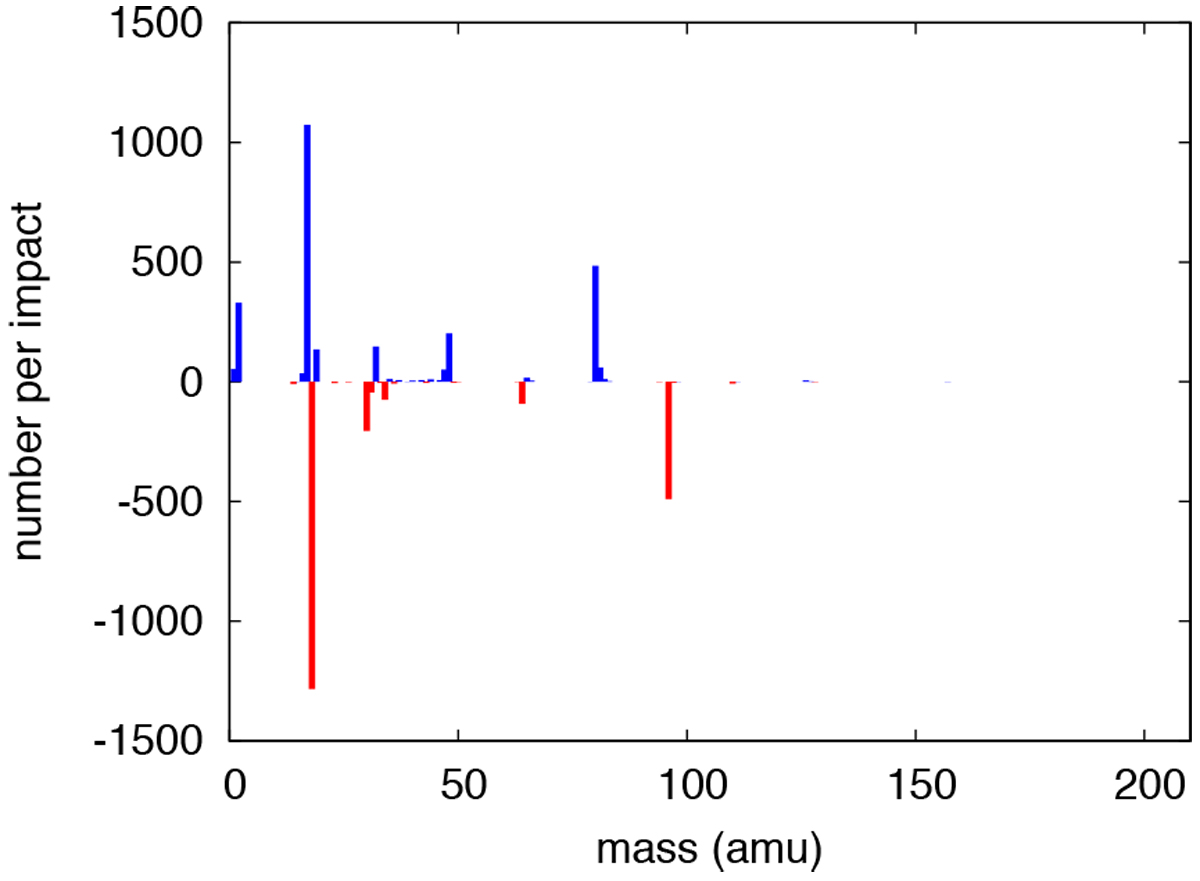
Difference mass spectrum showing the number of molecules at a time of 38.5 ps after track formation relative to those present in the relaxed simulation volume. Positive values (blue) show species produced in the track, negative values (red) show species destroyed in the track.
Current usage metrics show cumulative count of Article Views (full-text article views including HTML views, PDF and ePub downloads, according to the available data) and Abstracts Views on Vision4Press platform.
Data correspond to usage on the plateform after 2015. The current usage metrics is available 48-96 hours after online publication and is updated daily on week days.
Initial download of the metrics may take a while.