Free Access
Fig. 6
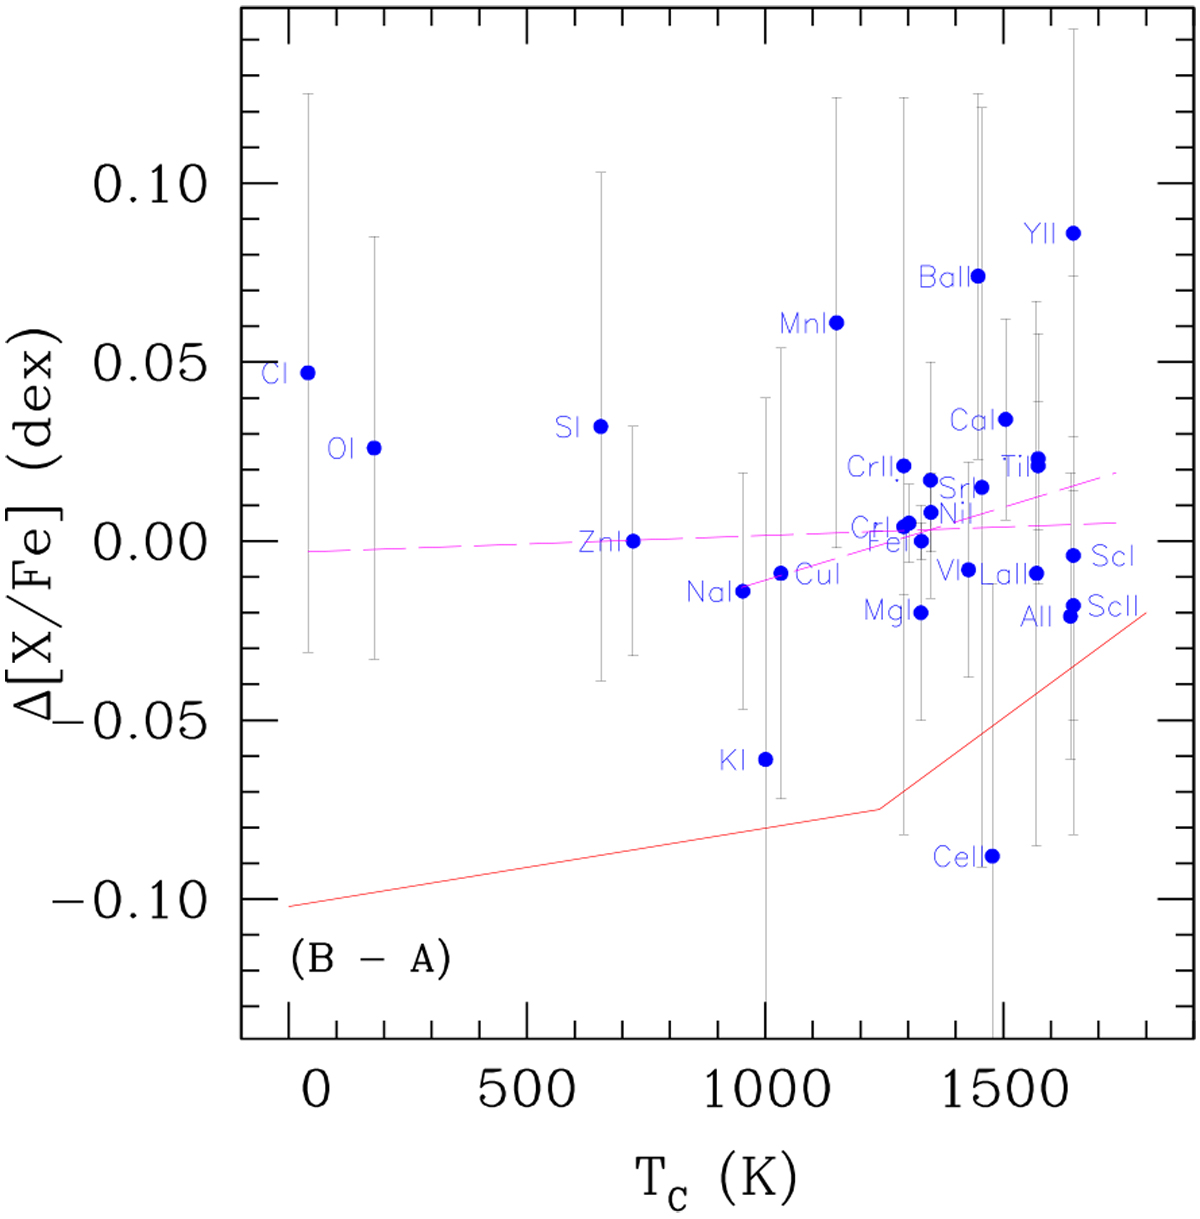
Differential abundances (B − A) versus condensation temperature Tc. Long-dashed lines are a weighted linear fit to all and to the refractory species. The solar-twins trend of M 09 is shown with a continuous red line (vertically shifted for comparison).
Current usage metrics show cumulative count of Article Views (full-text article views including HTML views, PDF and ePub downloads, according to the available data) and Abstracts Views on Vision4Press platform.
Data correspond to usage on the plateform after 2015. The current usage metrics is available 48-96 hours after online publication and is updated daily on week days.
Initial download of the metrics may take a while.