Fig. 10
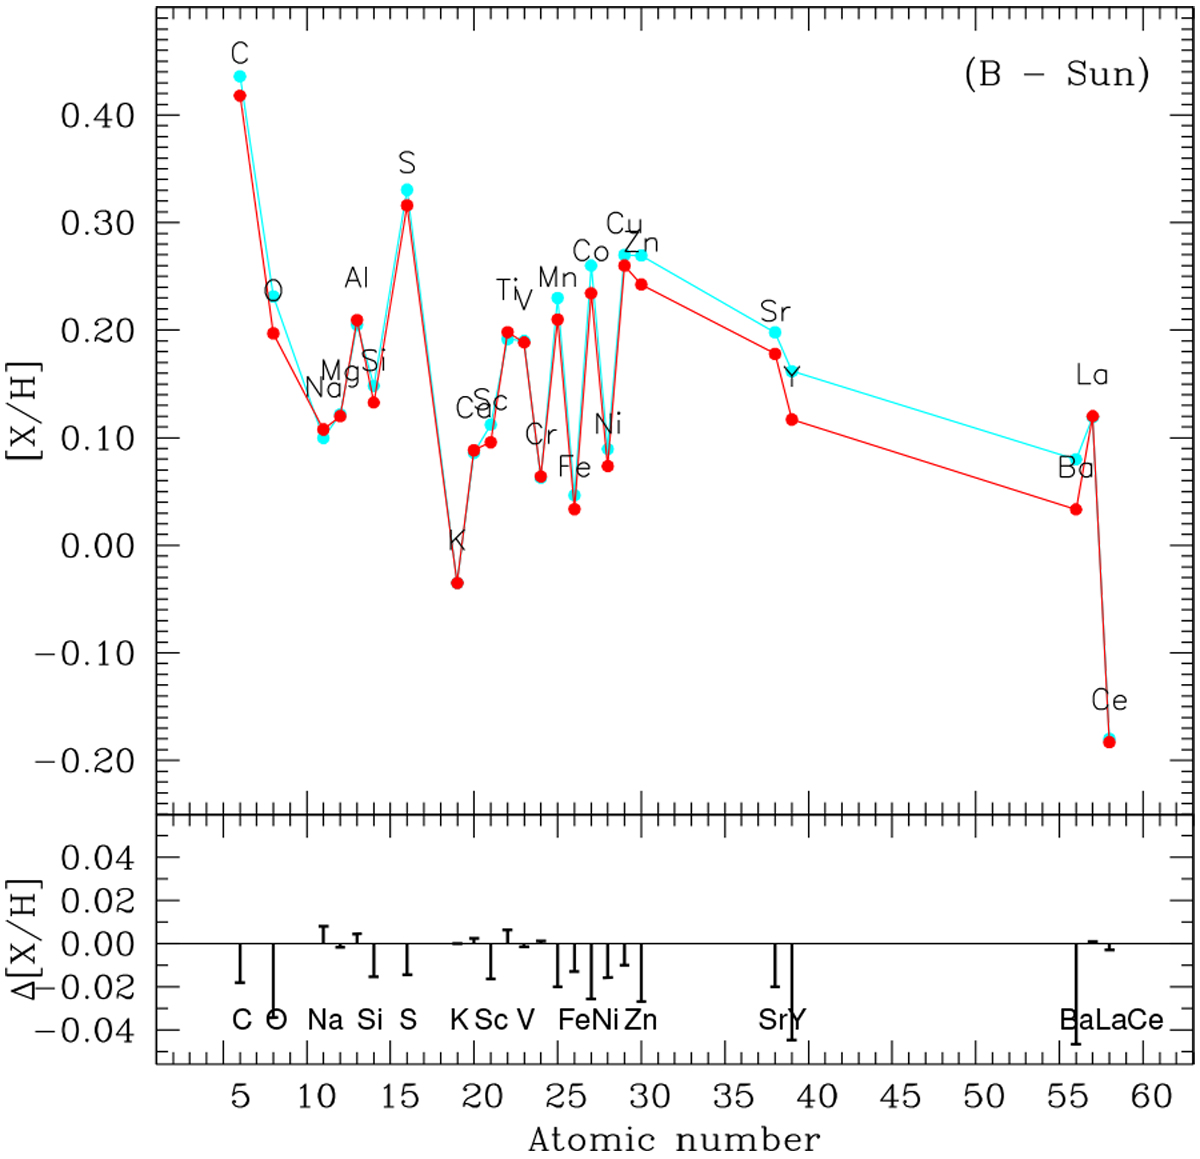
Differential abundances (B − Sun) versus atomic number. Red circles and lines correspond to the non-solar-scaled method, while cyan circles and lines correspond to the other “corrected” solar-scaled method. The lower panel presents with bars the difference between both procedures (as non-solar-scaled − corrected solar-scaled method).
Current usage metrics show cumulative count of Article Views (full-text article views including HTML views, PDF and ePub downloads, according to the available data) and Abstracts Views on Vision4Press platform.
Data correspond to usage on the plateform after 2015. The current usage metrics is available 48-96 hours after online publication and is updated daily on week days.
Initial download of the metrics may take a while.