Fig. 4.
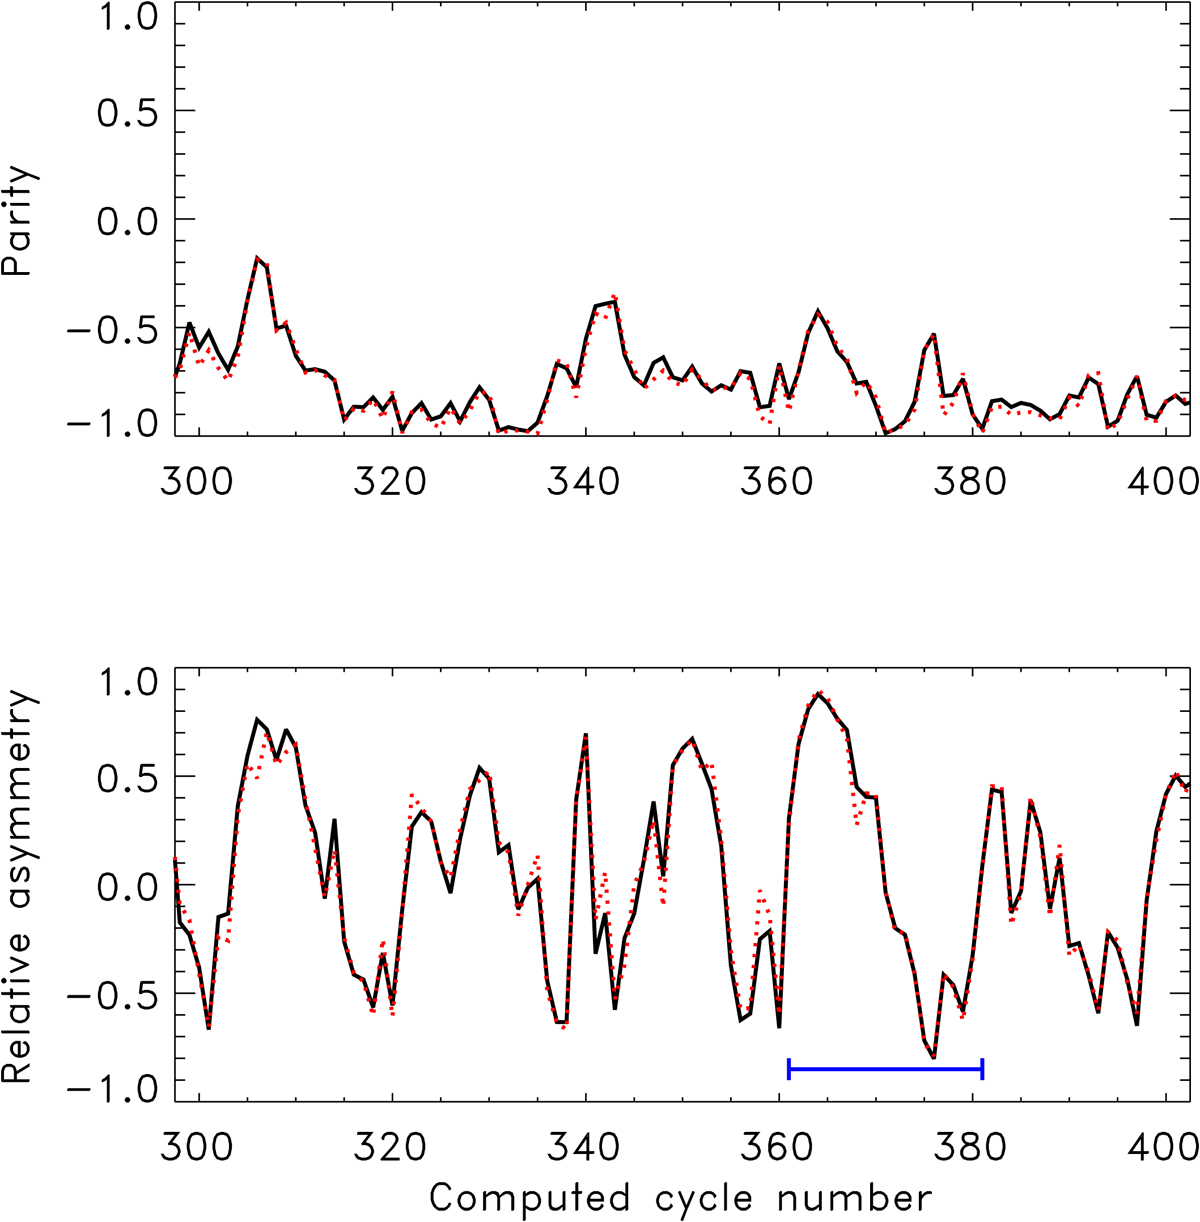
Top panel: time-averaged parity of individual cycles (full line) and instant values of the parity of Eq. (14) at the cycles’ maxima (dotted) as the functions of computed cycle number. The data points for individual cycles are connected by straight lines for better visibility. Bottom panel: asymmetry measure (Eq. (12)) of the toroidal field for the cycles’ maxima (full line) and the asymmetry (Eq. (13)) of the polar fields at the cycles’ beginnings (dotted). The straight horizontal line indicates the range, for which the next two plots show the detailed time dependencies.
Current usage metrics show cumulative count of Article Views (full-text article views including HTML views, PDF and ePub downloads, according to the available data) and Abstracts Views on Vision4Press platform.
Data correspond to usage on the plateform after 2015. The current usage metrics is available 48-96 hours after online publication and is updated daily on week days.
Initial download of the metrics may take a while.