Fig. 9.
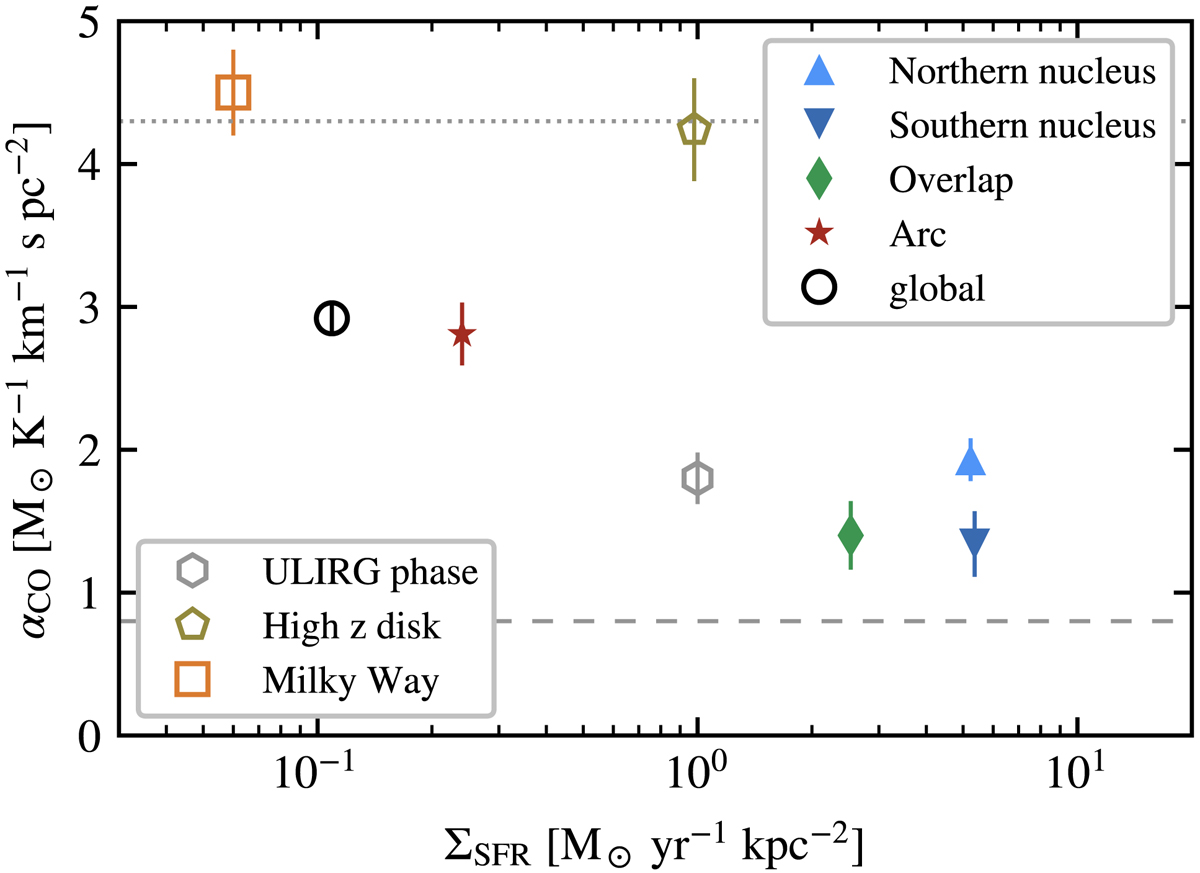
The αCO factor as a function of the surface density of SFR in the four selected regions (1 kpc × 1 kpc, filled symbols), for the entire merger system (global), the same system during the ULIRG phase, a gas-rich clumpy disk (high-redshift) and a Milky Way-like galaxy (open symbols). The error bars show the dispersions of the values, evaluated by varying the line of sight (see Sect. 2.2). Horizontal lines indicate the values commonly used in observations (4.3 for disks, Bolatto et al. 2013, and 0.8 for ULIRGs, Downes & Solomon 1998). Important variations in αCO are found across the galaxies, due to different interplays of physical processes setting the assembly of star-forming regions, and making our regions lie in between the values traditionally assumed for disks and ULIRGs.
Current usage metrics show cumulative count of Article Views (full-text article views including HTML views, PDF and ePub downloads, according to the available data) and Abstracts Views on Vision4Press platform.
Data correspond to usage on the plateform after 2015. The current usage metrics is available 48-96 hours after online publication and is updated daily on week days.
Initial download of the metrics may take a while.