Fig. 7.
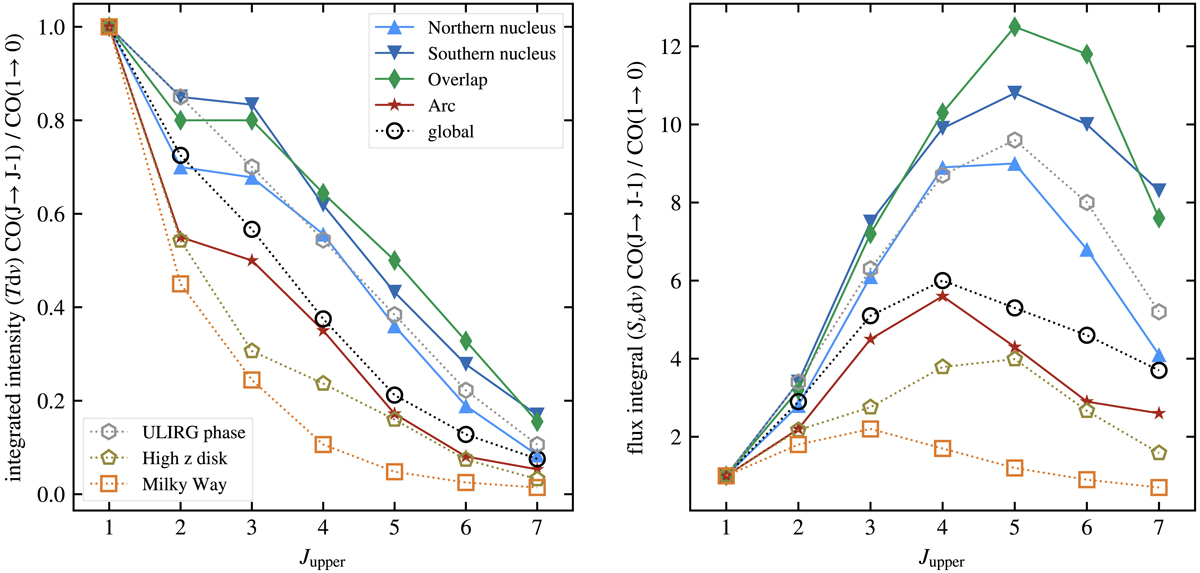
CO spectral line energy distributions for velocity-integrated brightness temperature (left) and velocity-integrated flux density (right), both normalized to CO(1–0), in our four selected regions (filled symbols), in the entire system (global), in the same simulation but during the starburst episode (ULIRG), in a gas-rich clumpy disk (high-redshift), and in a Milky Way-like galaxy (open symbols). The SLEDs of the most actively star-forming regions (nuclei and overlap) resemble that of the Antennae (global and ULIRG), while the arc better matches the high-redshift disk at high Jupper.
Current usage metrics show cumulative count of Article Views (full-text article views including HTML views, PDF and ePub downloads, according to the available data) and Abstracts Views on Vision4Press platform.
Data correspond to usage on the plateform after 2015. The current usage metrics is available 48-96 hours after online publication and is updated daily on week days.
Initial download of the metrics may take a while.