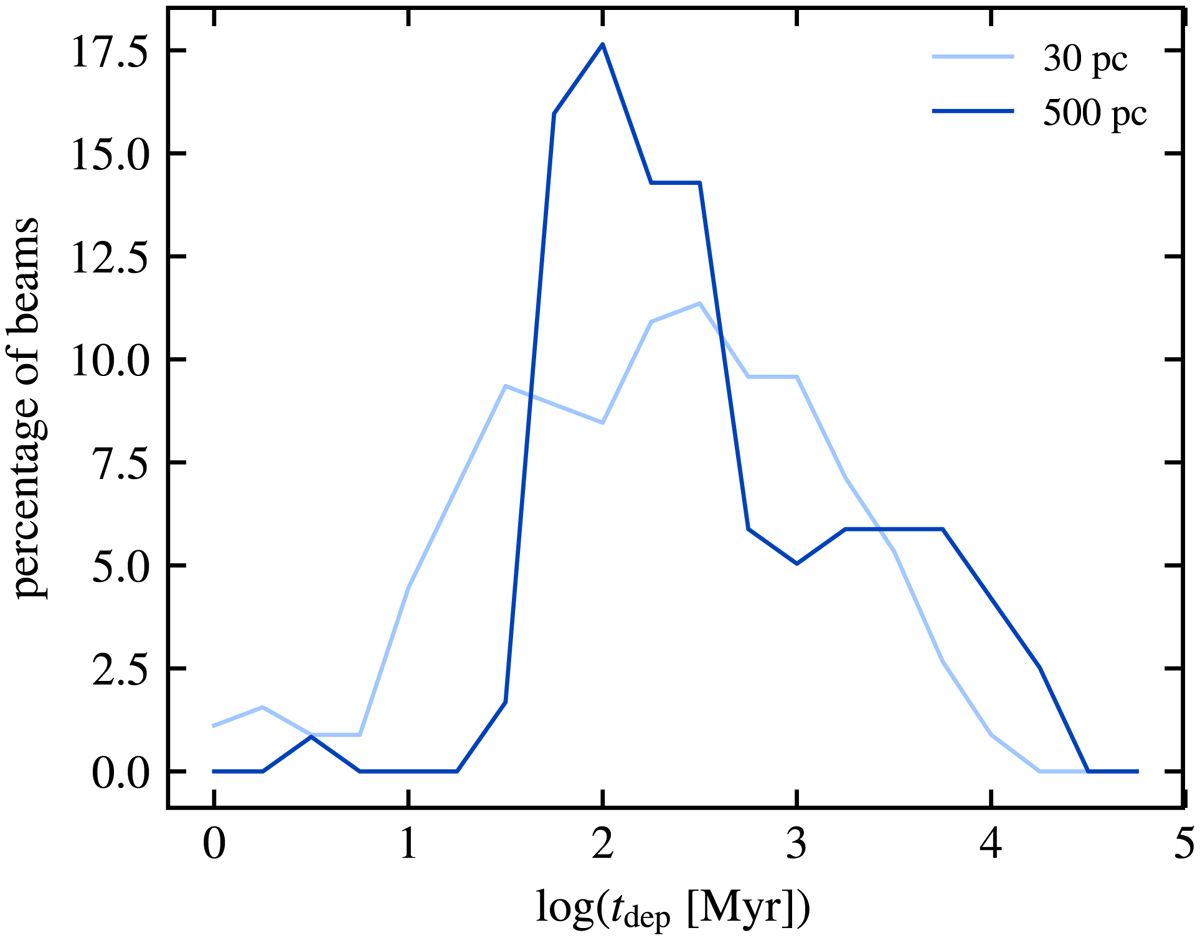
Fig. 6.

Distribution of depletion times, measured in 30 pc and 500 pc beams on a Cartesian grid (with arbitrary origin, i.e., not centered on peaks of star formation) in the central 6 kpc × 6 kpc of the system. For better statistics, we repeat the measurements by shifting the origin of the grid by several fractions of the beam size, and stack the distributions obtained. Large-scale measurements have a bimodal distribution of short (∼100 Myr) and long (∼2 Gyr) tdep.
Current usage metrics show cumulative count of Article Views (full-text article views including HTML views, PDF and ePub downloads, according to the available data) and Abstracts Views on Vision4Press platform.
Data correspond to usage on the plateform after 2015. The current usage metrics is available 48-96 hours after online publication and is updated daily on week days.
Initial download of the metrics may take a while.


