Fig. 4.
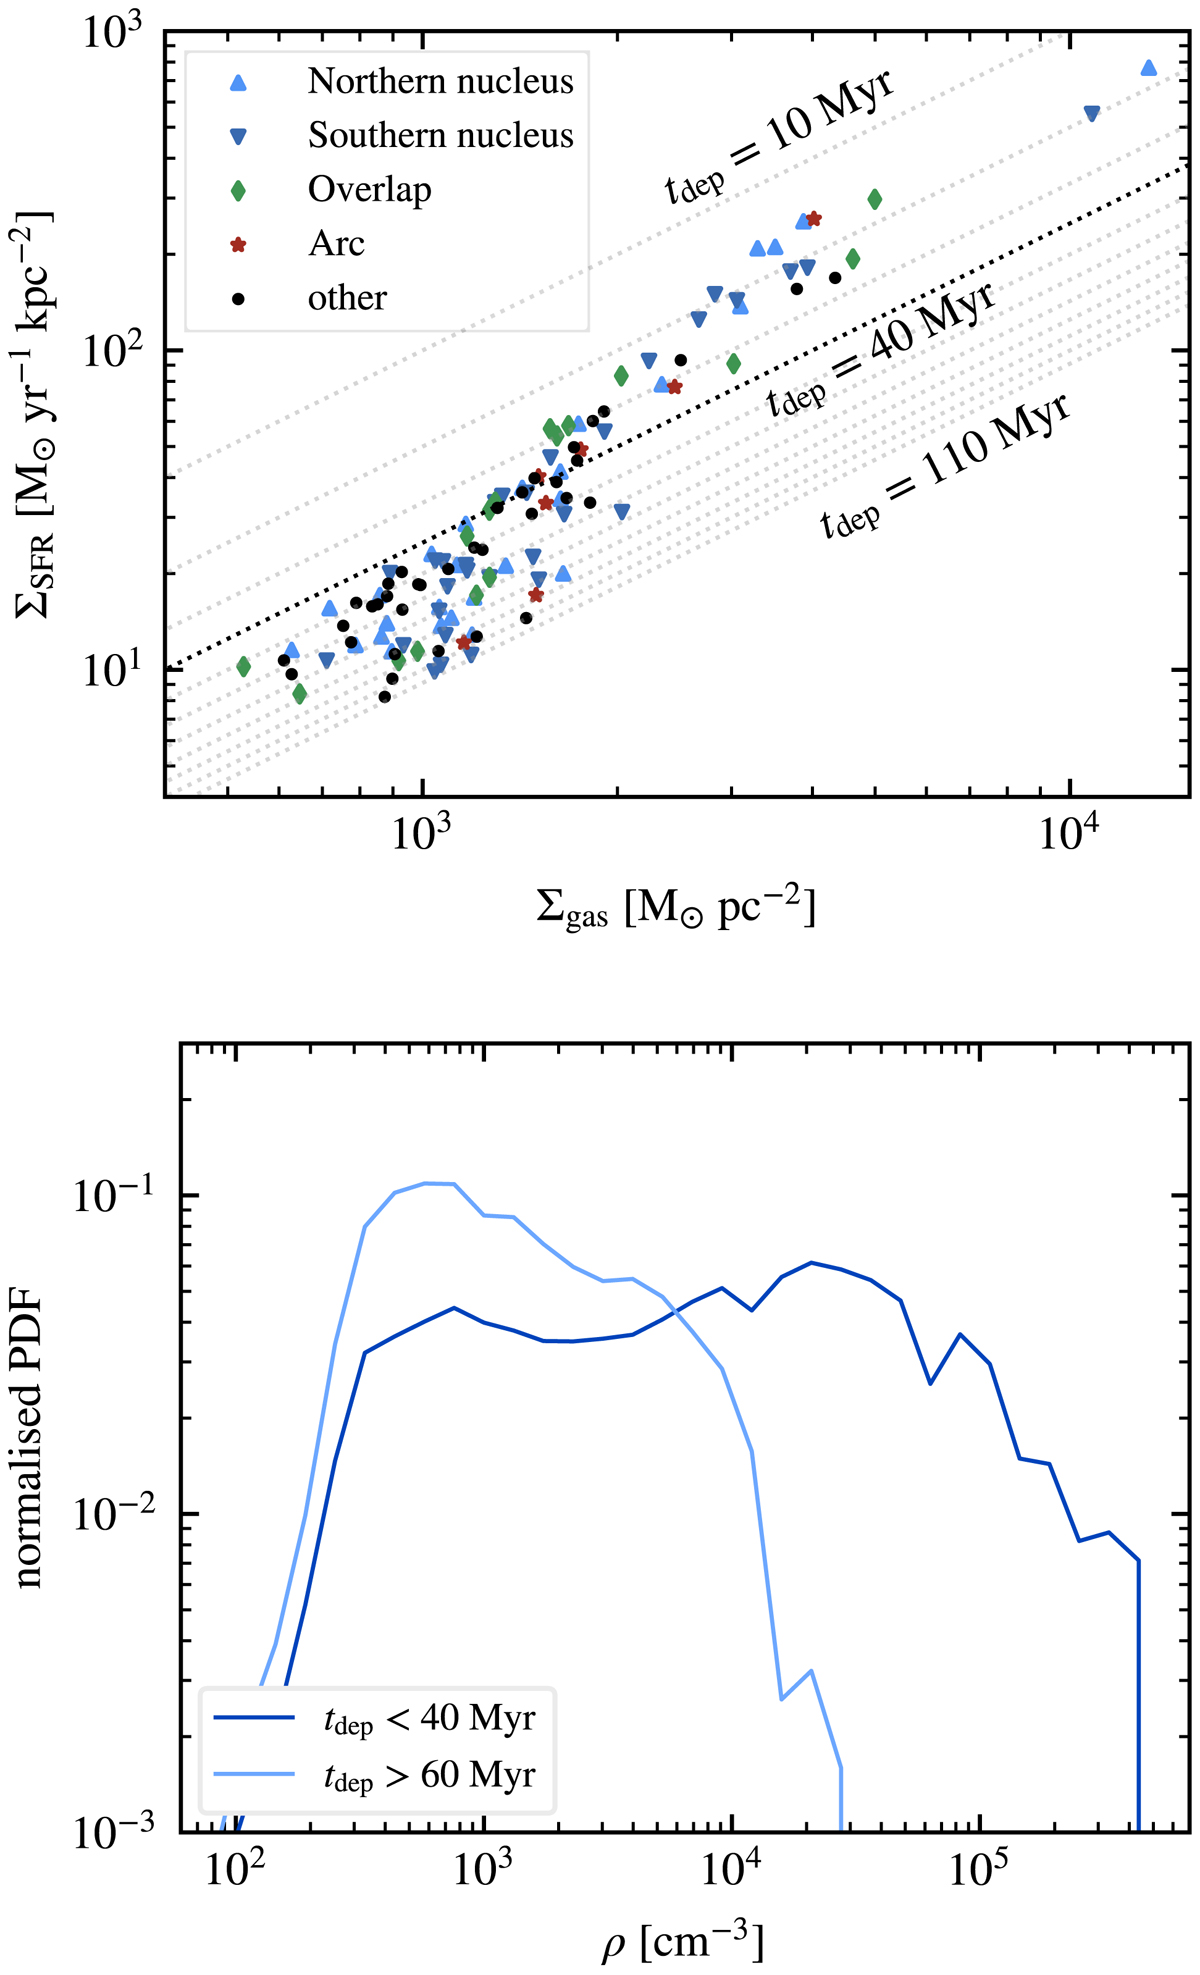
Top: Schmidt–Kennicutt diagram of the clouds identified in the simulation. The two densest points correspond to the clouds at the galactic centers. The dotted lines mark constant depletion times (from 10 to 110 Myr, in steps of 10 Myr); the dark line corresponds to 40 Myr. Bottom: normalized mass-weighted gas density PDF of these clouds, split into two regimes of depletion times: < 40 and > 60 Myr. Clouds with 40 Myr < tdep < 60 Myr correspond to the transition regime shown in the top panel and are not considered here for the sake of clarity. The distribution of clouds does not follow a unique power law, but rather a combination of two regimes: clouds with an excess of dense gas have shorter depletion times than those without.
Current usage metrics show cumulative count of Article Views (full-text article views including HTML views, PDF and ePub downloads, according to the available data) and Abstracts Views on Vision4Press platform.
Data correspond to usage on the plateform after 2015. The current usage metrics is available 48-96 hours after online publication and is updated daily on week days.
Initial download of the metrics may take a while.