Fig. 2.
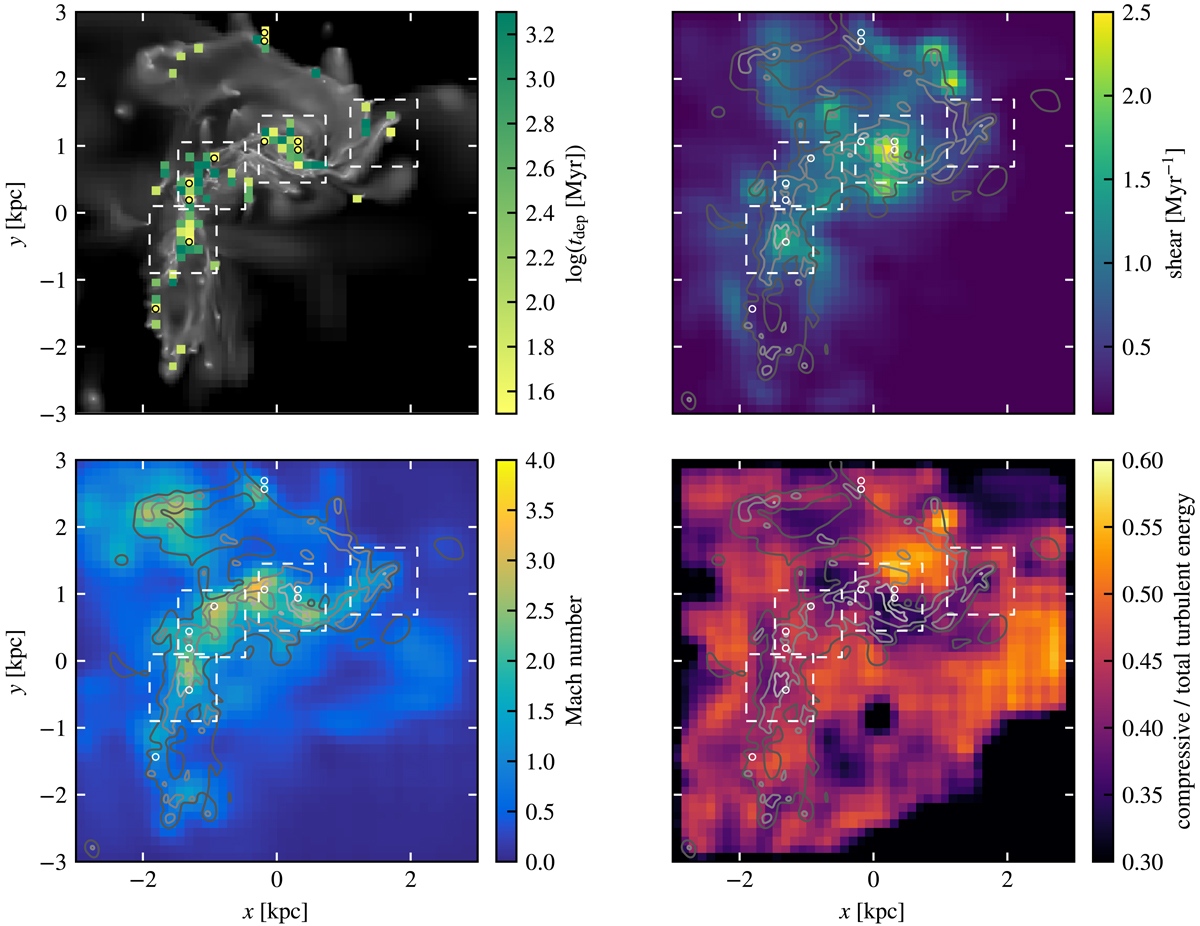
Maps of the depletion time (top left), shear (top right), Mach number (bottom left), and the compressive-to-total ratio of turbulent energy (bottom right). A grayscale map of the gas density is underlaid in the top left panel and is represented as contours in the others to guide the eye. The depletion time and Mach numbers are measured at a scale of 125 pc, using stars younger than 10 Myr for the former, while the shear and compressive-to-total ratio are measured at 50 pc and their maps are density weighted histograms with a bin size of 125 pc. Small circles indicate the positions of minima of depletion times and the dashed squares show our four regions of interest. No clear correlations between these quantities are visible. This is due to the time delay between the onset of a physical trigger and the resulting star formation activity being of the same order of magnitude as the dynamical time of the merger (∼10 Myr).
Current usage metrics show cumulative count of Article Views (full-text article views including HTML views, PDF and ePub downloads, according to the available data) and Abstracts Views on Vision4Press platform.
Data correspond to usage on the plateform after 2015. The current usage metrics is available 48-96 hours after online publication and is updated daily on week days.
Initial download of the metrics may take a while.