Free Access
Fig. A.1.
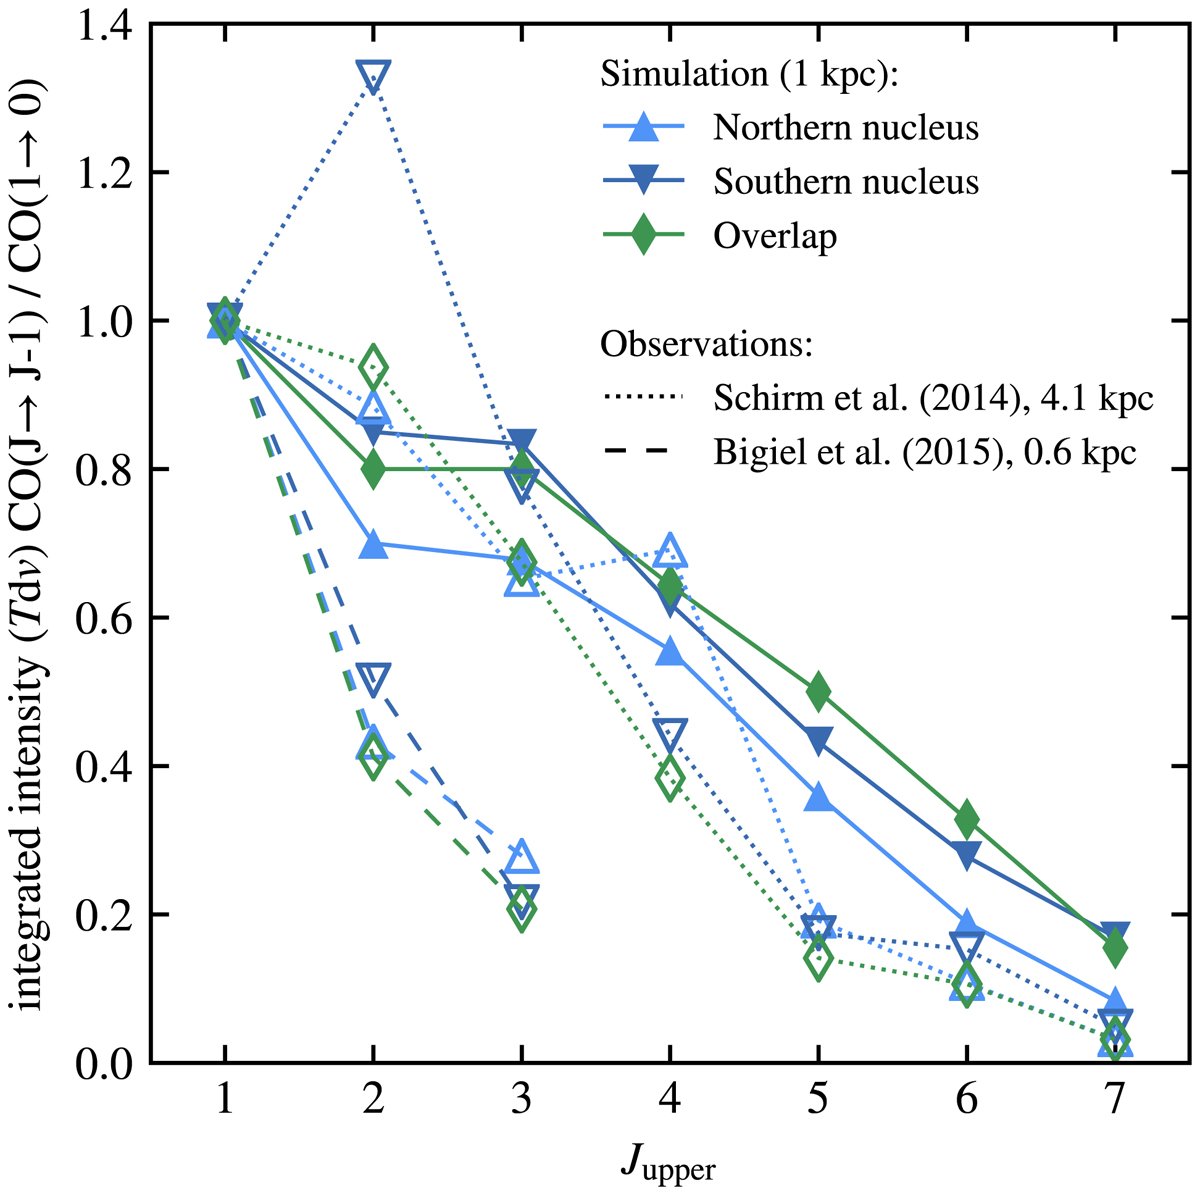
SLEDs in velocity-integrated intensities from the simulation compared to observations from Schirm et al. (2014) and Bigiel et al. (2015) of the equivalent regions in the real Antennae. Shown is the average of the three overlap points presented in Bigiel et al. (2010, 2015).
Current usage metrics show cumulative count of Article Views (full-text article views including HTML views, PDF and ePub downloads, according to the available data) and Abstracts Views on Vision4Press platform.
Data correspond to usage on the plateform after 2015. The current usage metrics is available 48-96 hours after online publication and is updated daily on week days.
Initial download of the metrics may take a while.