Free Access
Fig. 1.
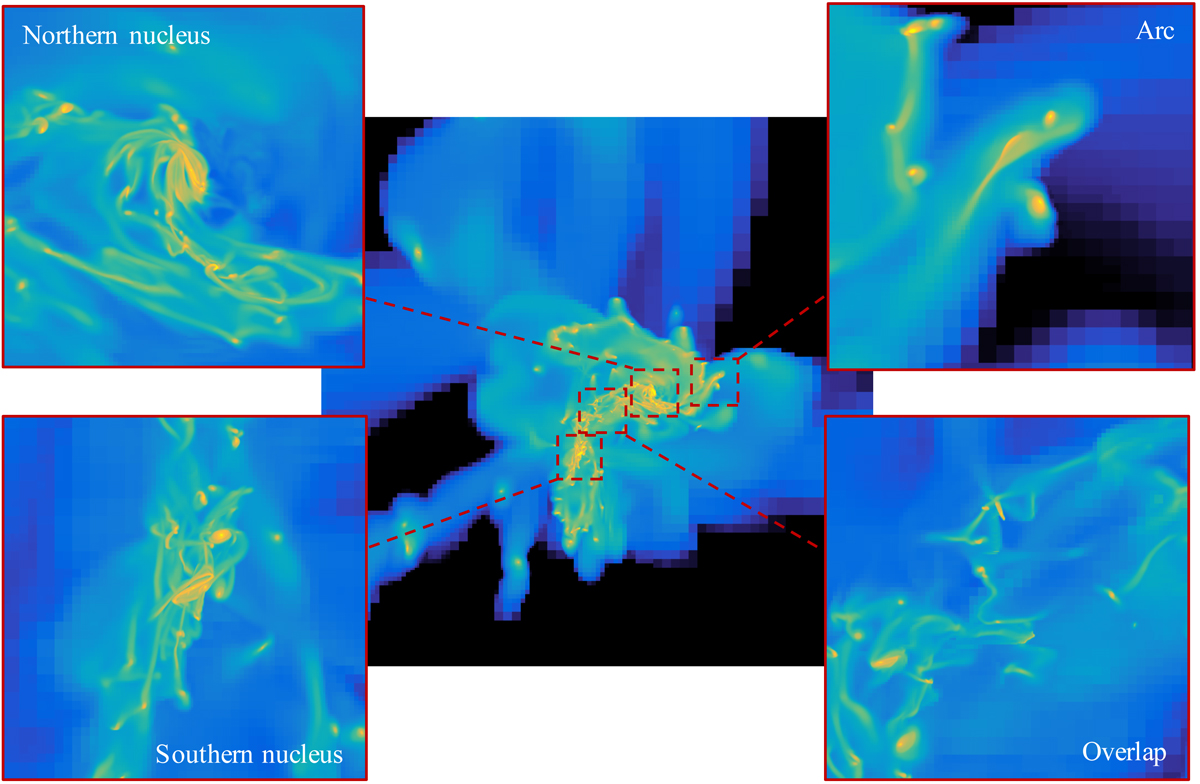
Gas density map of the central 12 kpc × 12 kpc of the merger. The connections with the long tidal tails are visible on the left-hand side. The smaller panels show magnifications of the four 1 kpc × 1 kpc regions where our analysis is conducted.
Current usage metrics show cumulative count of Article Views (full-text article views including HTML views, PDF and ePub downloads, according to the available data) and Abstracts Views on Vision4Press platform.
Data correspond to usage on the plateform after 2015. The current usage metrics is available 48-96 hours after online publication and is updated daily on week days.
Initial download of the metrics may take a while.