Free Access
Fig. 2.
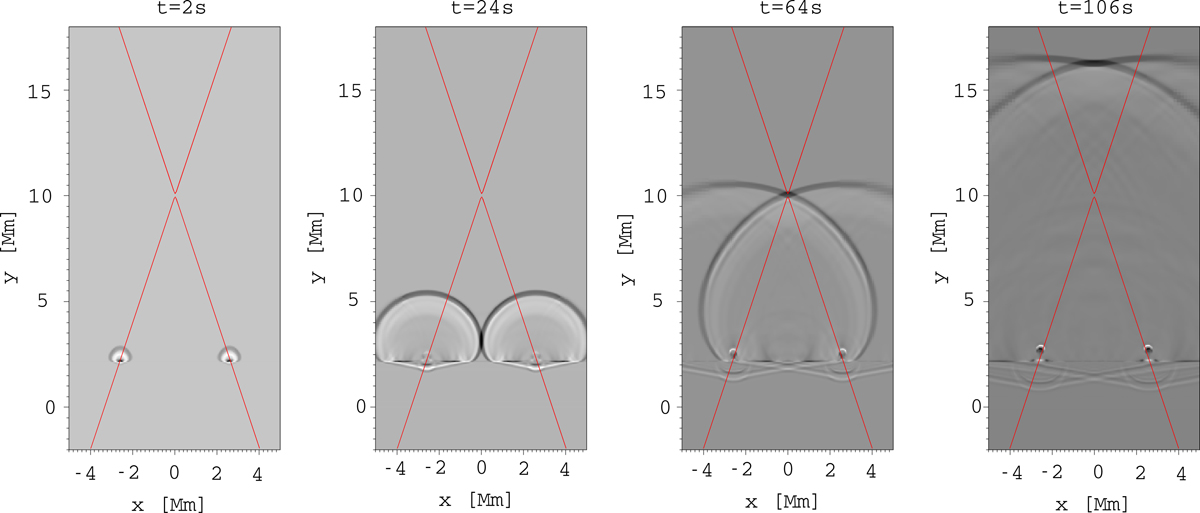
Temporal evolution of changes in mass density Δ𝜚/𝜚0 at four different times, t = 2, 26, 64, and 106 s. The initial pressure pulse was launched in TR on separatrices (solid red lines).
Current usage metrics show cumulative count of Article Views (full-text article views including HTML views, PDF and ePub downloads, according to the available data) and Abstracts Views on Vision4Press platform.
Data correspond to usage on the plateform after 2015. The current usage metrics is available 48-96 hours after online publication and is updated daily on week days.
Initial download of the metrics may take a while.