Fig. 1.
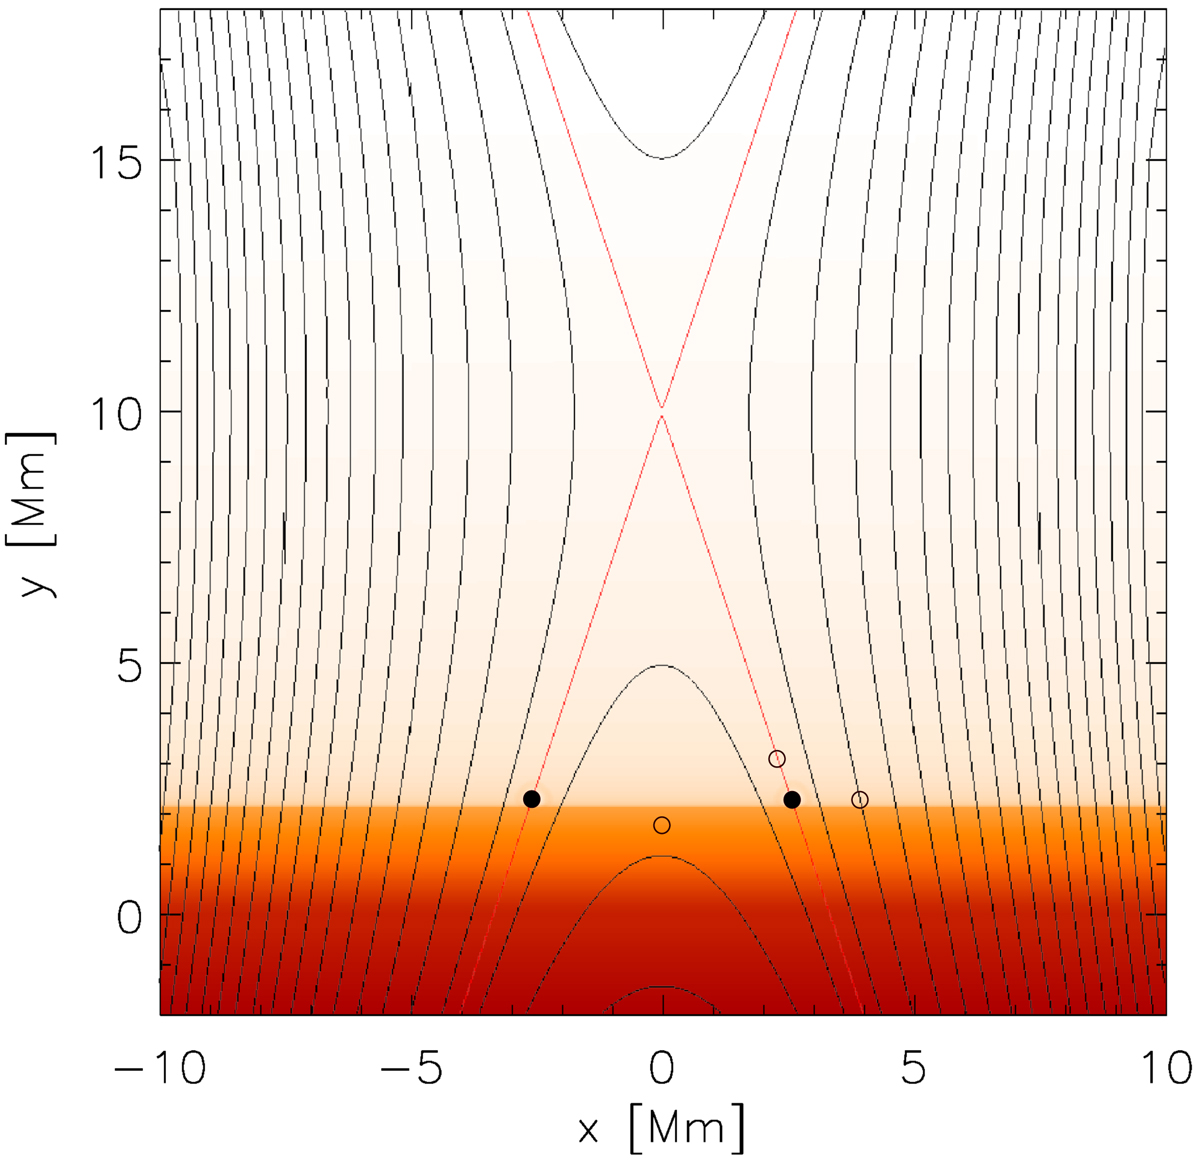
Sketch of the initial state in the equilibrium represented by the distribution of gas pressure (in logarithmic scale) and magnetic field lines (black lines) along with the separatrices (red lines). The initial pressure pulses are depicted as two black full circles at separatrices at a height of 2.25 Mm above the photosphere, i.e. in the TR. The three unfilled black circles represent the detection points.
Current usage metrics show cumulative count of Article Views (full-text article views including HTML views, PDF and ePub downloads, according to the available data) and Abstracts Views on Vision4Press platform.
Data correspond to usage on the plateform after 2015. The current usage metrics is available 48-96 hours after online publication and is updated daily on week days.
Initial download of the metrics may take a while.