Fig. 5
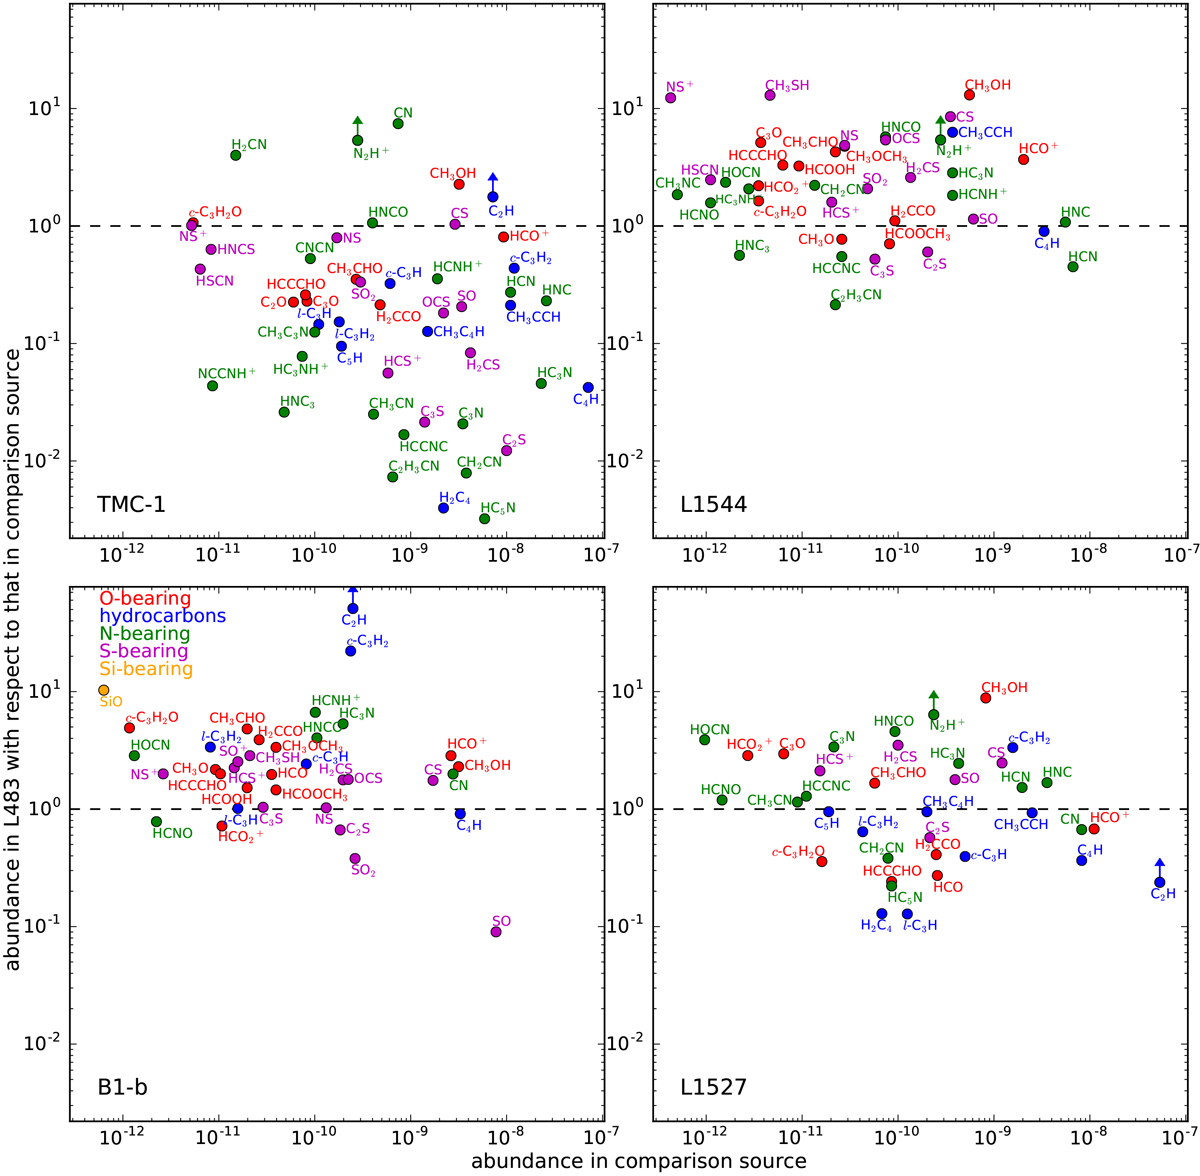
Fractional abundances relative to H2 in L483 are compared with those in another four reference sources: TMC-1, L1544, B1-b, and L1527. The abundance ratios between L483 and the reference source are plotted against the fractional abundance in the corresponding reference source. Upper and lower limits are indicated by arrows. Different chemical families are plotted in different colors (see legend in bottom–left panel). Beam-averaged column densities derived from single-dish observations in the reference sources are taken from the literature. TMC-1: Adande et al. (2010); Agúndez & Wakelam (2013); Agúndez et al. (2015b, 2018b); Gratier et al. (2016); Loison et al. (2016, 2017); Cernicharo et al. (2018); Marcelino et al. (in prep.). L1544: Caselli et al. (2002); Gupta et al. (2009); Marcelino et al. (2009, 2010); Vastel et al. (2014, 2015, 2016, 2018a,b); Jiménez-Serra et al. (2016); Quénard et al. (2017); Cernicharo et al. (2018). B1-b: Marcelino et al. (2005, 2009, 2010); Agúndez et al. (2008); Öberg et al. (2010); Cernicharo et al. (2012); Loison et al. (2016, 2017); Fuente et al. (2016); Widicus Weaver et al. (2017); Marcelino et al. (in prep.). L1527: Sakai et al. (2008b); Marcelino et al. (2009, 2010); Araki et al. (2017); Yoshida et al. (2019). Adopted H2 column densities (needed to convert molecular column densities to fractional abundances) are 1 × 1022 cm−2 for TMC-1 (Cernicharo & Guélin 1987), 5.4 × 1022 cm−2 for L1544 (Jiménez-Serra et al. 2016), 7.6 × 1022 cm−2 for B1-b (Daniel et al. 2013), and 2.8 × 1022 cm−2 for L1527 (Jørgensen et al. 2002).
Current usage metrics show cumulative count of Article Views (full-text article views including HTML views, PDF and ePub downloads, according to the available data) and Abstracts Views on Vision4Press platform.
Data correspond to usage on the plateform after 2015. The current usage metrics is available 48-96 hours after online publication and is updated daily on week days.
Initial download of the metrics may take a while.