Fig. 4
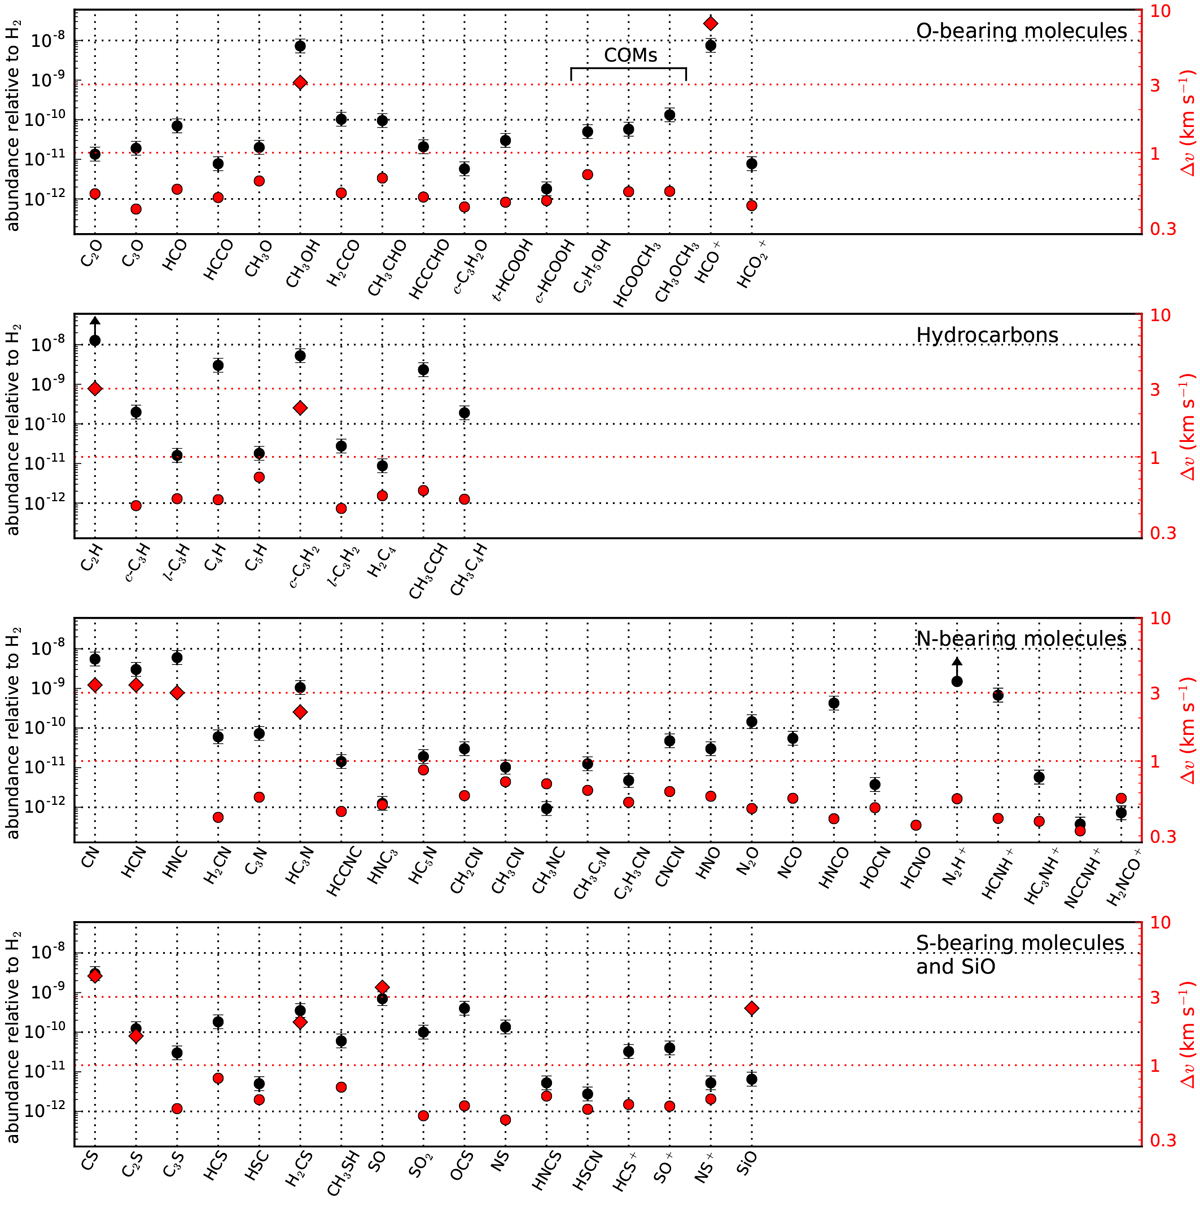
Visualization of molecular fractional abundances (in black and referred to the left axis) and line widths (in red and referred to the right axis) in L483 for different chemical families. Abundances are obtained from the beam-averaged column densities listed in Table 1, adopting a column density of H2 of 4 × 1022 cm−2 (see Sect. 4.2). CO is not plotted. For molecules with optically thick lines we used the column densities of optically thin isotopologs and scaled up adopting local ISM isotopic ratios as follows: for HCO+ the 17O isotopolog was used adopting 16O/17O = 2317 (Wouterloot et al. 2008); for CN, HCN, and HNC we used the 15N isotopolog assuming 14N/15N = 290 (Adande et al. 2012); and for CH3OH and CS we used the 13C isotopolog and assumed 12C/13C = 68 (Milam et al. 2005). In the cases of C2H and N2H+, scaling from 13C and 15N isotopologs, respectively, is probably not valid due to important fractionation effects (see Sects. 4.5.2 and 4.5.3), and therefore only lower limits are given. H2CO and NH3 are not shown because we only detect deuterated forms and the deuterium fractionation is uncertain for these species. Line widthsrepresented as red circles are averages over the FWHM of all those lines fitted to a Gaussian function (Δv in Table A.1). For those molecules showing complex profiles (e.g., wings) the values plotted as red diamonds correspond to the highest velocity |VLSR − vsys| at which emission is detected.
Current usage metrics show cumulative count of Article Views (full-text article views including HTML views, PDF and ePub downloads, according to the available data) and Abstracts Views on Vision4Press platform.
Data correspond to usage on the plateform after 2015. The current usage metrics is available 48-96 hours after online publication and is updated daily on week days.
Initial download of the metrics may take a while.