Fig. 3
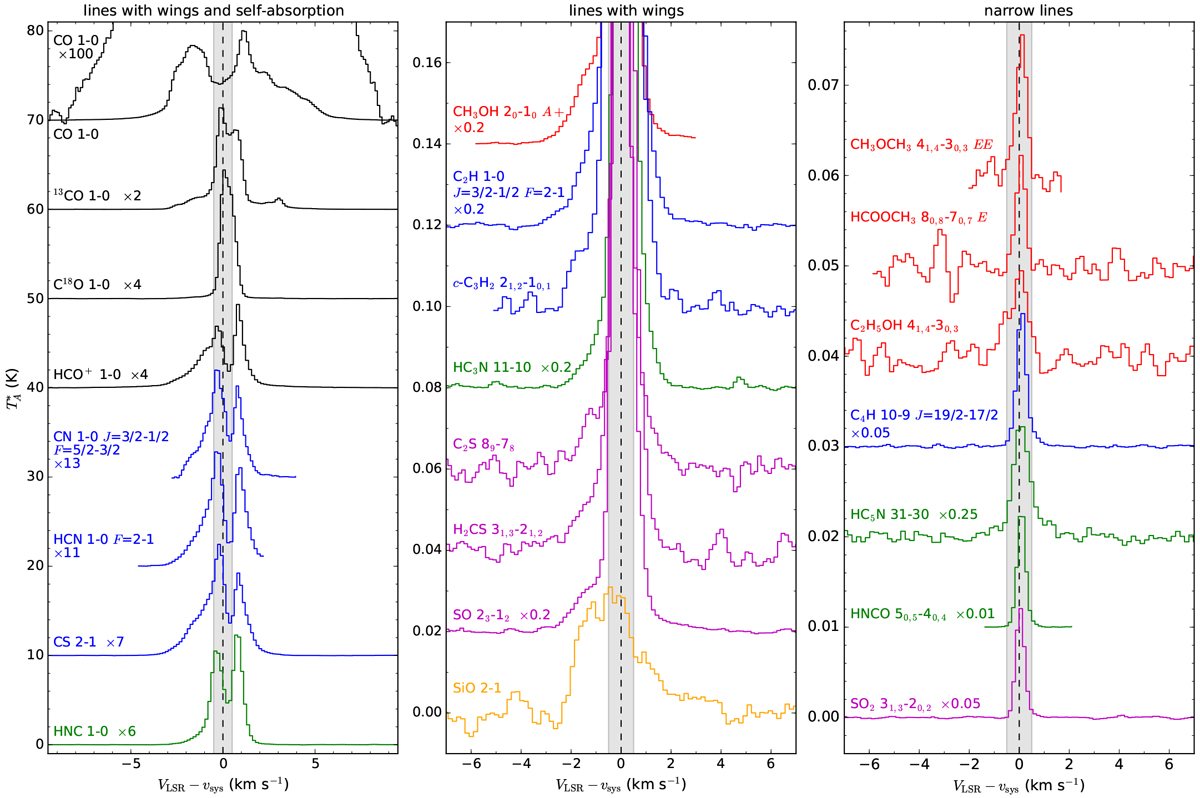
Characteristic line profiles observed with the IRAM 30 m telescope in the λ3 mm band toward L483. Left panel: lines with wings and self-absorption (except C18O J = (1–0)). Middle panel: lines that show wings. Right panel: sample of narrow lines, which form the majority in our line survey. The gray shaded area indicates the velocity range ± 0.5 km s−1 around the systemic velocity of the source.
Current usage metrics show cumulative count of Article Views (full-text article views including HTML views, PDF and ePub downloads, according to the available data) and Abstracts Views on Vision4Press platform.
Data correspond to usage on the plateform after 2015. The current usage metrics is available 48-96 hours after online publication and is updated daily on week days.
Initial download of the metrics may take a while.