Free Access
Fig. 2
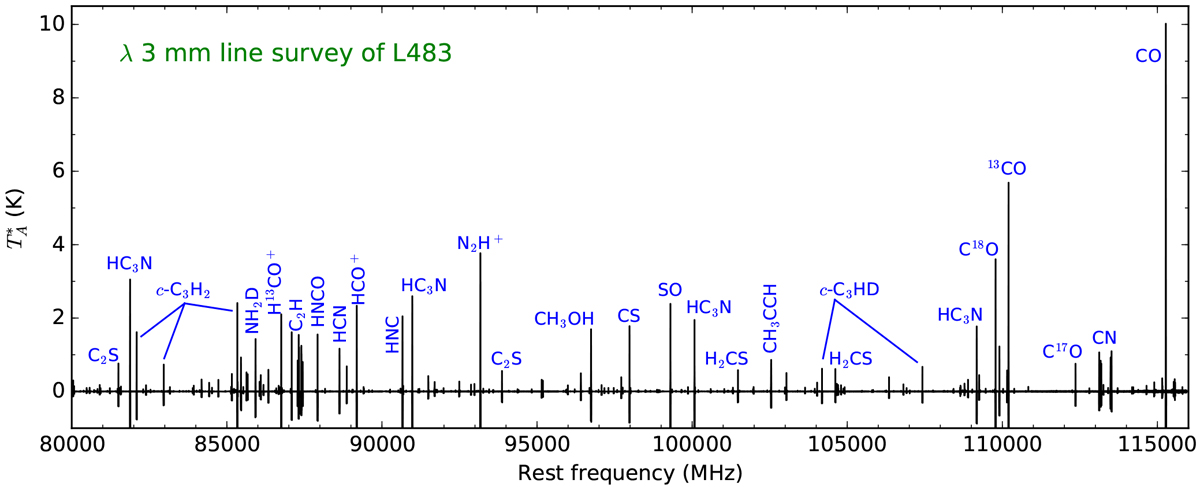
Overview of the λ3 mm line survey of L483 covering the frequency range 80–116 GHz. The carriers of the most intense lines are indicated. Negative signals correspond to the artifacts caused by the frequency-switching technique.
Current usage metrics show cumulative count of Article Views (full-text article views including HTML views, PDF and ePub downloads, according to the available data) and Abstracts Views on Vision4Press platform.
Data correspond to usage on the plateform after 2015. The current usage metrics is available 48-96 hours after online publication and is updated daily on week days.
Initial download of the metrics may take a while.