Fig. 6.
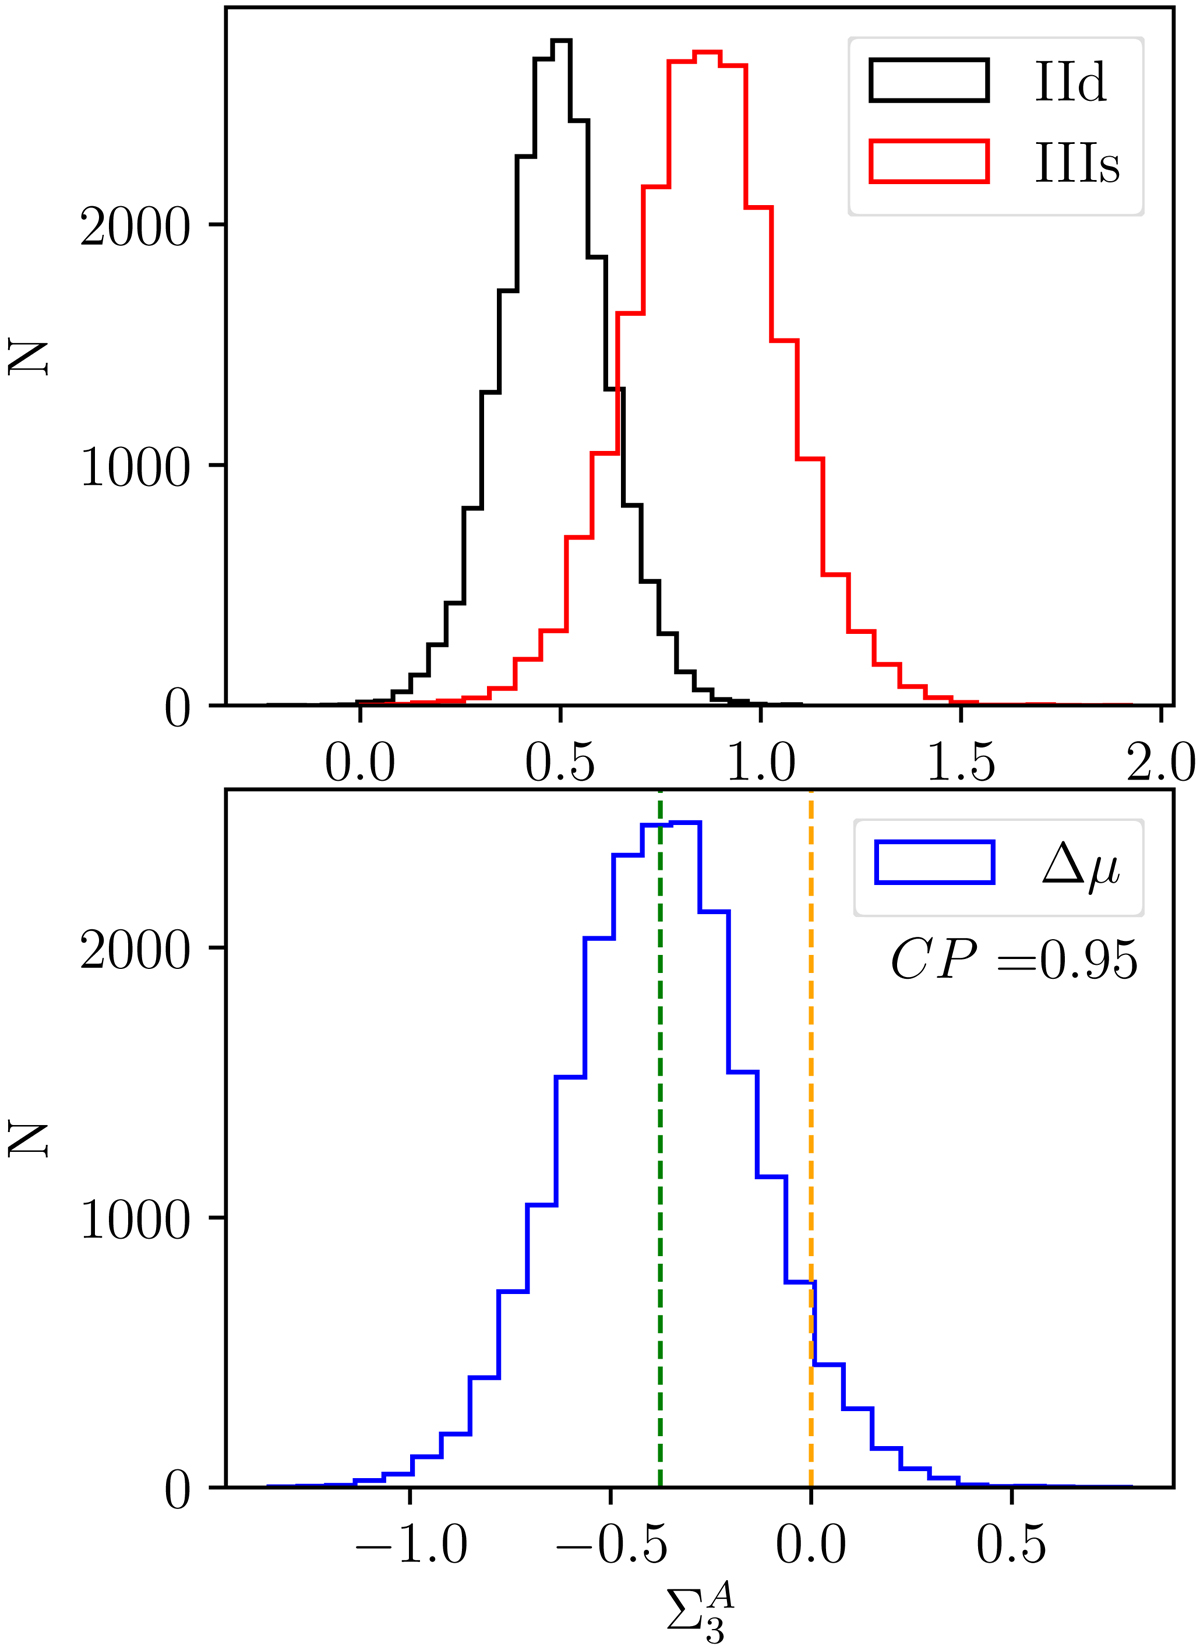
Demonstrating the posterior distributions of the mean vs. that of the difference in means, using the BEST method (see text). Top: posterior distributions of the mean third nearest neighbor surface density ![]() for galaxies with outermost breaks of Type IId and IIIs. Bottom: posterior distribution of the difference in the mean
for galaxies with outermost breaks of Type IId and IIIs. Bottom: posterior distribution of the difference in the mean ![]() between Type IId and IIIs galaxies. The green dashed line shows the median of this distribution, while the orange dashed line shows Δμ = 0.0. The means differ by ∼1.7σ, and likewise the posterior distribution of Δμ peaks below 0.0 with ∼95% confidence.
between Type IId and IIIs galaxies. The green dashed line shows the median of this distribution, while the orange dashed line shows Δμ = 0.0. The means differ by ∼1.7σ, and likewise the posterior distribution of Δμ peaks below 0.0 with ∼95% confidence.
Current usage metrics show cumulative count of Article Views (full-text article views including HTML views, PDF and ePub downloads, according to the available data) and Abstracts Views on Vision4Press platform.
Data correspond to usage on the plateform after 2015. The current usage metrics is available 48-96 hours after online publication and is updated daily on week days.
Initial download of the metrics may take a while.