Fig. 5.
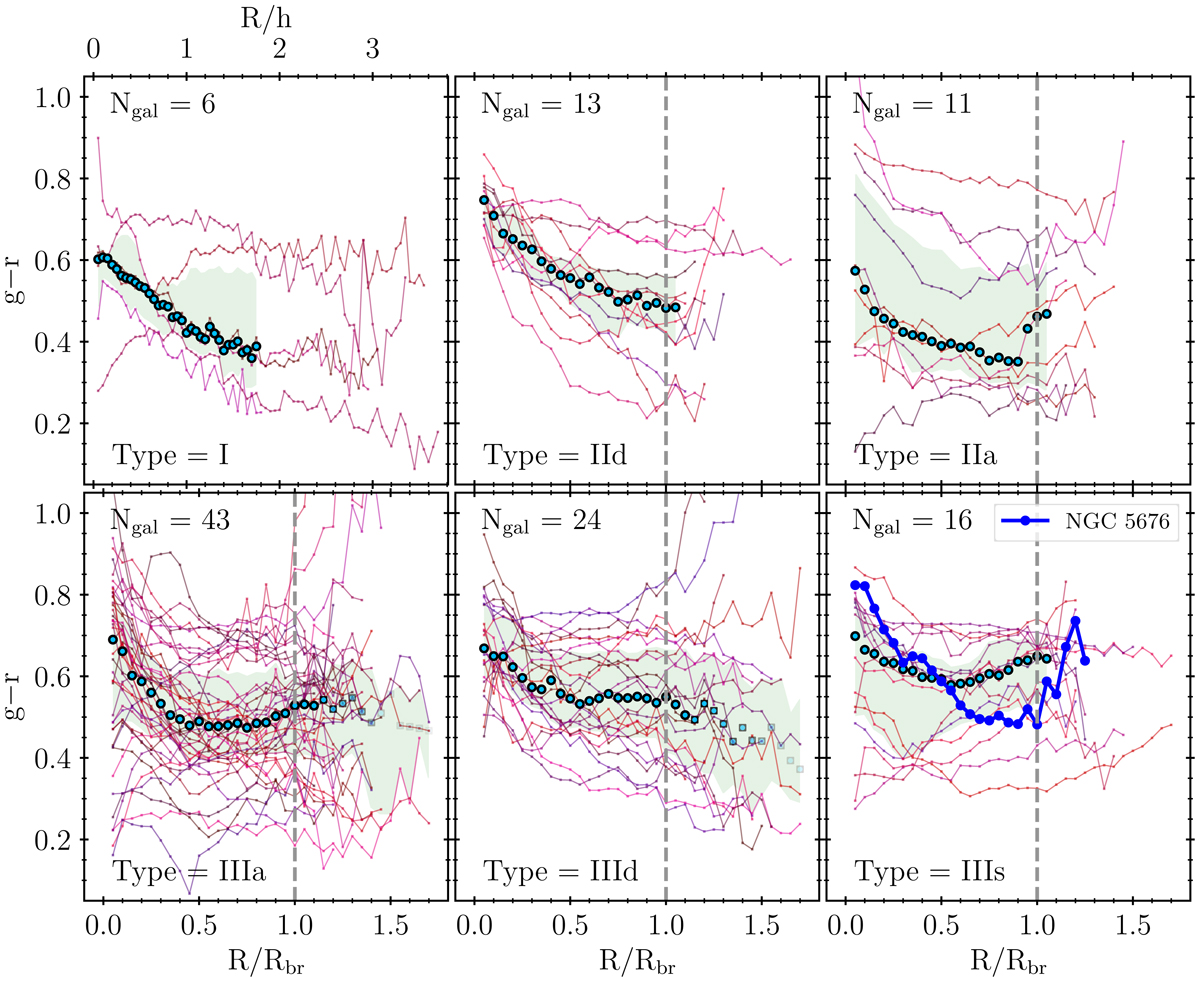
g − r color profiles of sample galaxies, with radii normalized by the radius of the outermost break. In the case of Type I galaxies, the profiles are normalized instead by the disk scale length. Curves and points in shades of red through purple denote individual galaxy profiles, with the total number of profiles in each panel given as Ngal. Light blue points denote the median of all profiles at each radial bin, with the interquartile range (IQR) shown as the light green shaded region. For panels with Ngal < 20, we show the median values and IQRs only where all galaxies contribute; for those with Ngal > 20, marker transparency is calculated as the number of contributing galaxies at that radial bin divided by Ngal. The blue curve in the lower right panel shows the color profile of NGC 5676, the only Type IIIs galaxy in our sample with an extended blueward color gradient (see text).
Current usage metrics show cumulative count of Article Views (full-text article views including HTML views, PDF and ePub downloads, according to the available data) and Abstracts Views on Vision4Press platform.
Data correspond to usage on the plateform after 2015. The current usage metrics is available 48-96 hours after online publication and is updated daily on week days.
Initial download of the metrics may take a while.