Fig. 3.
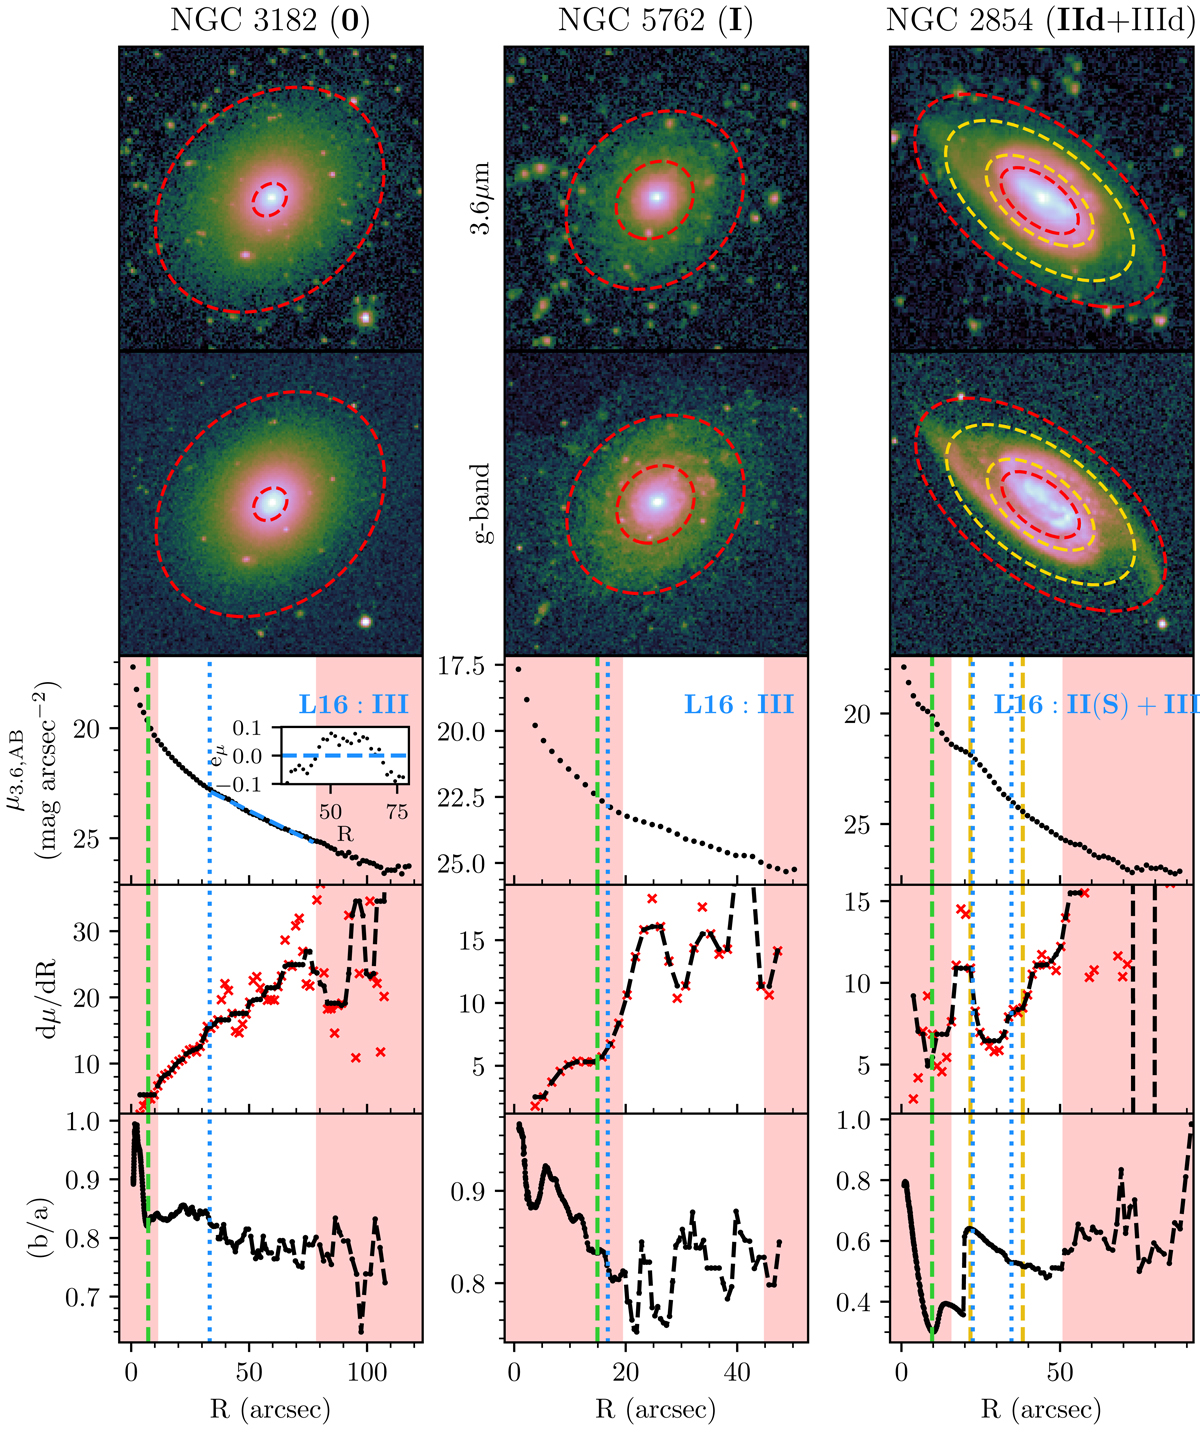
Examples of our break classification scheme. We show here galaxies of Type 0 (left), Type I (middle), and a Type IId break (right, innermost break). These are reclassifications of galaxies with Type III breaks identified by L16. Bold text indicates the break being demonstrated, and the original break classifications are provided in the third row panels. Ellipses are as in Fig. 1. Third row: 3.6 μm surface brightness profile (AB magnitudes) vs. radius. The inset in the left panel shows the residuals to a linear fit (shown as the dashed blue line) to the surface brightness profile beyond the break radius, demonstrating its nonexponential nature. Fourth row: local slope of the surface brightness profile vs. radius. Fifth row: galaxy’s on-sky axial ratio vs. radius. Vertical lines and shaded regions are as in Fig. 1. See the text for specific details on each galaxy’s break classification.
Current usage metrics show cumulative count of Article Views (full-text article views including HTML views, PDF and ePub downloads, according to the available data) and Abstracts Views on Vision4Press platform.
Data correspond to usage on the plateform after 2015. The current usage metrics is available 48-96 hours after online publication and is updated daily on week days.
Initial download of the metrics may take a while.