Fig. 2.
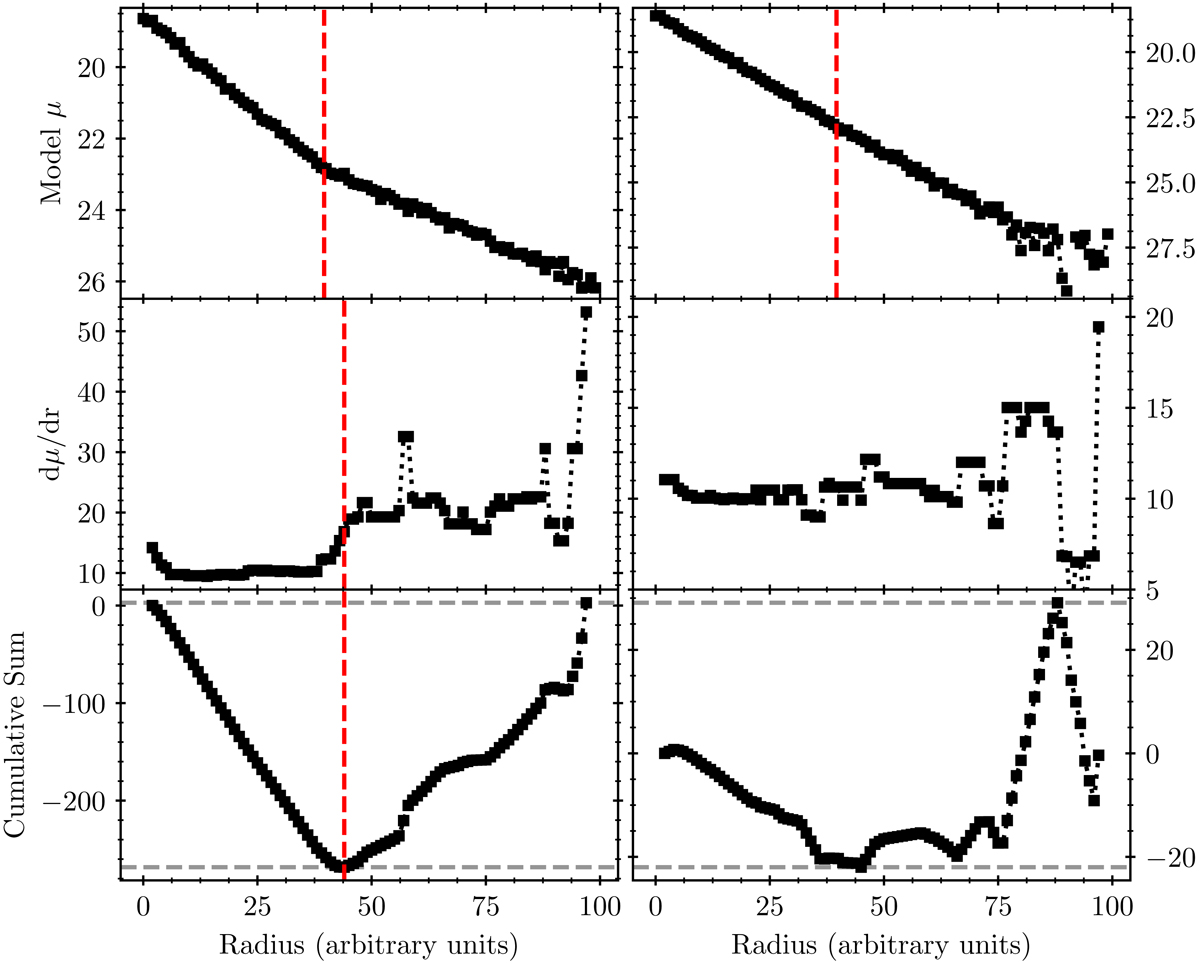
Demonstration of break-finding algorithm. Top: two idealized model Type III surface brightness profiles, with Poisson and simulated sky noise added. Both profiles use the same inner disk slope; the left profile contains a break with hin/hout = 0.5, while the right profile contains a break with hin/hout = 0.9. Red dashed lines mark the break radius. Middle: the local slope profiles of the model surface brightness profiles. The red dashed line in the left profile marks the break radius as determined by our break-finding algorithm. No significant break was found for the right profile. Bottom: cumulative sums, as defined in Eq. (2), with the break radius of the left profile again marked with a red dashed line. Gray dashed lines mark the locations of the maximum and minimum values of CS (in the text, max(CS) and min(CS)). We note that the minimum CS of the right profile occurs at the same location as the left profile; the break, however, was not found to be significant and is therefore not shown.
Current usage metrics show cumulative count of Article Views (full-text article views including HTML views, PDF and ePub downloads, according to the available data) and Abstracts Views on Vision4Press platform.
Data correspond to usage on the plateform after 2015. The current usage metrics is available 48-96 hours after online publication and is updated daily on week days.
Initial download of the metrics may take a while.