Fig. A.1.
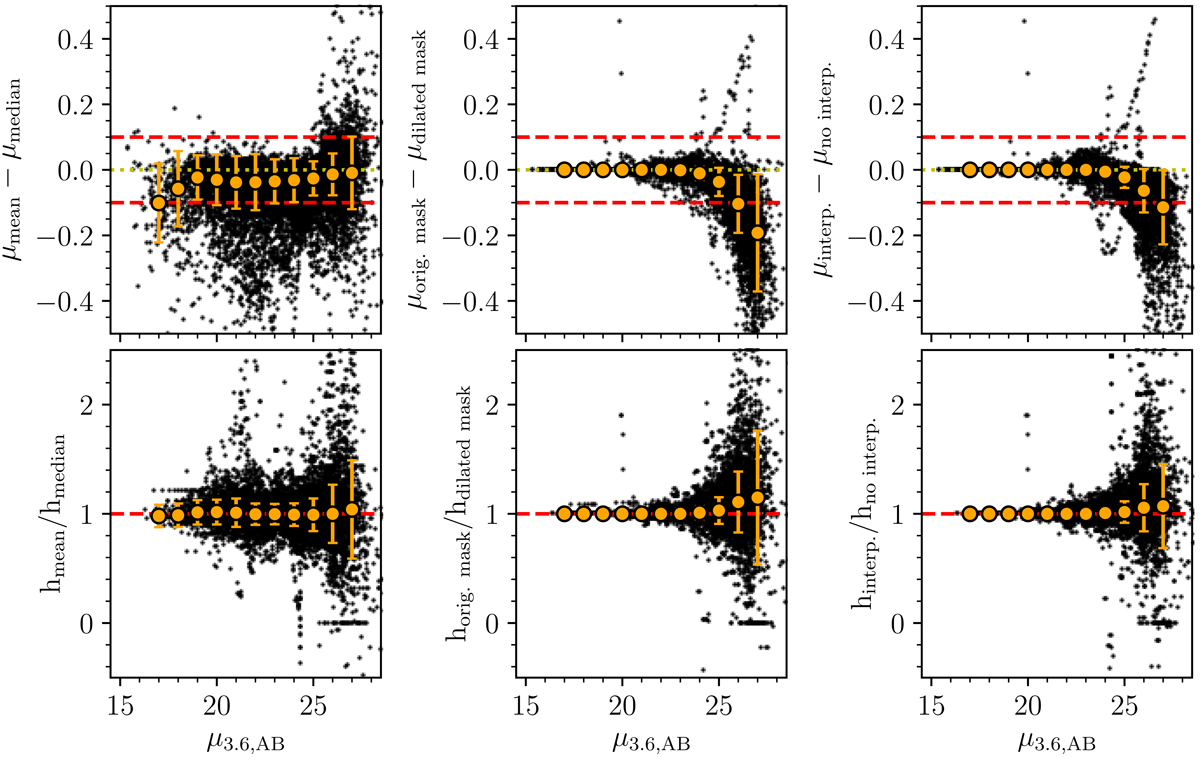
Showcasing systematic effects of different methods on the derivation of surface brightness as a function of radius, and local slope as a function of radius. Top row panels: from left to right (all plotted as a function of surface brightness): difference between mean and median surface brightnesses; difference between surface brightnesses measured using the original S4G masks from Muñoz-Mateos et al. (2015) and those measured using dilated versions of the same masks; and surface brightnesses measured through interpolation across masks vs. those measured ignoring masked pixels. Bottom row panels: the same comparisons of systematics, but for the ratio of the measured local slopes (converted to scale length) using the varying methods. Orange points show the running median, with errorbars showing the interquartile range at each surface brightness bin. In the top row panels, red dashed lines show ±0.1 mag arcsec−2. In the bottom row panels, red dashed lines show a slope ratio of 1 (no difference between methods).
Current usage metrics show cumulative count of Article Views (full-text article views including HTML views, PDF and ePub downloads, according to the available data) and Abstracts Views on Vision4Press platform.
Data correspond to usage on the plateform after 2015. The current usage metrics is available 48-96 hours after online publication and is updated daily on week days.
Initial download of the metrics may take a while.