Fig. 1.
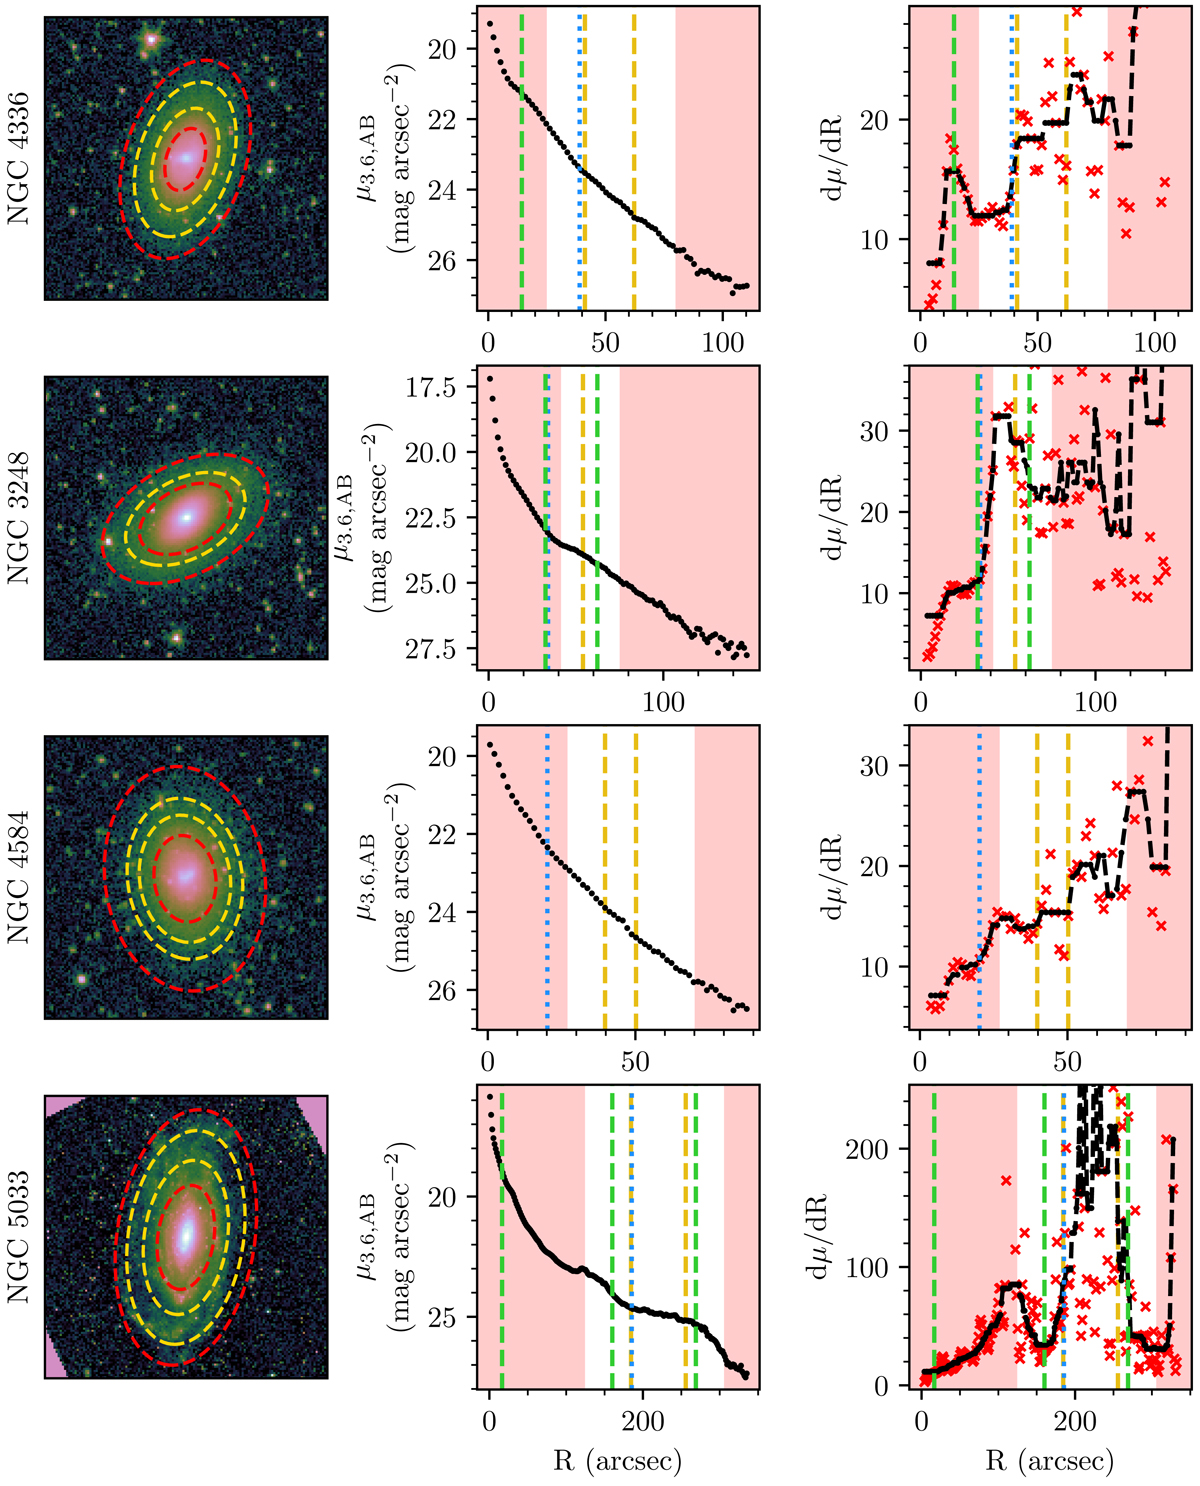
Demonstration of inner radius choice. Left column: 3.6 μm images of the demonstration galaxies, with the inner and outer radius fitting boundaries shown as red dashed ellipses and break radii as yellow ellipses. Middle column: these galaxies’ 3.6 μm surface brightness profiles. Red shaded regions denote the radial regions excluded from our break-finding procedure. Green dashed lines show the radii of inner rings, lenses, etc. used in determining the inner radius boundaries (see text), as well as outer rings, lenses etc. used for aiding in break classification. Yellow dashed lines mark break radii from our analysis, while blue dotted lines mark break radii from L16 (break classifications are discussed in more detail below). Finally, the right column shows the local slope of the surface brightness profile vs. radius; vertical lines are the same as in the middle column, and the red points show the local slope profile before median smoothing (see text). From the top row to the bottom, we demonstrate avoidance of: an inner ring; an inner lens; a nonexponential inner region; and an oval distortion.
Current usage metrics show cumulative count of Article Views (full-text article views including HTML views, PDF and ePub downloads, according to the available data) and Abstracts Views on Vision4Press platform.
Data correspond to usage on the plateform after 2015. The current usage metrics is available 48-96 hours after online publication and is updated daily on week days.
Initial download of the metrics may take a while.