Fig. 8
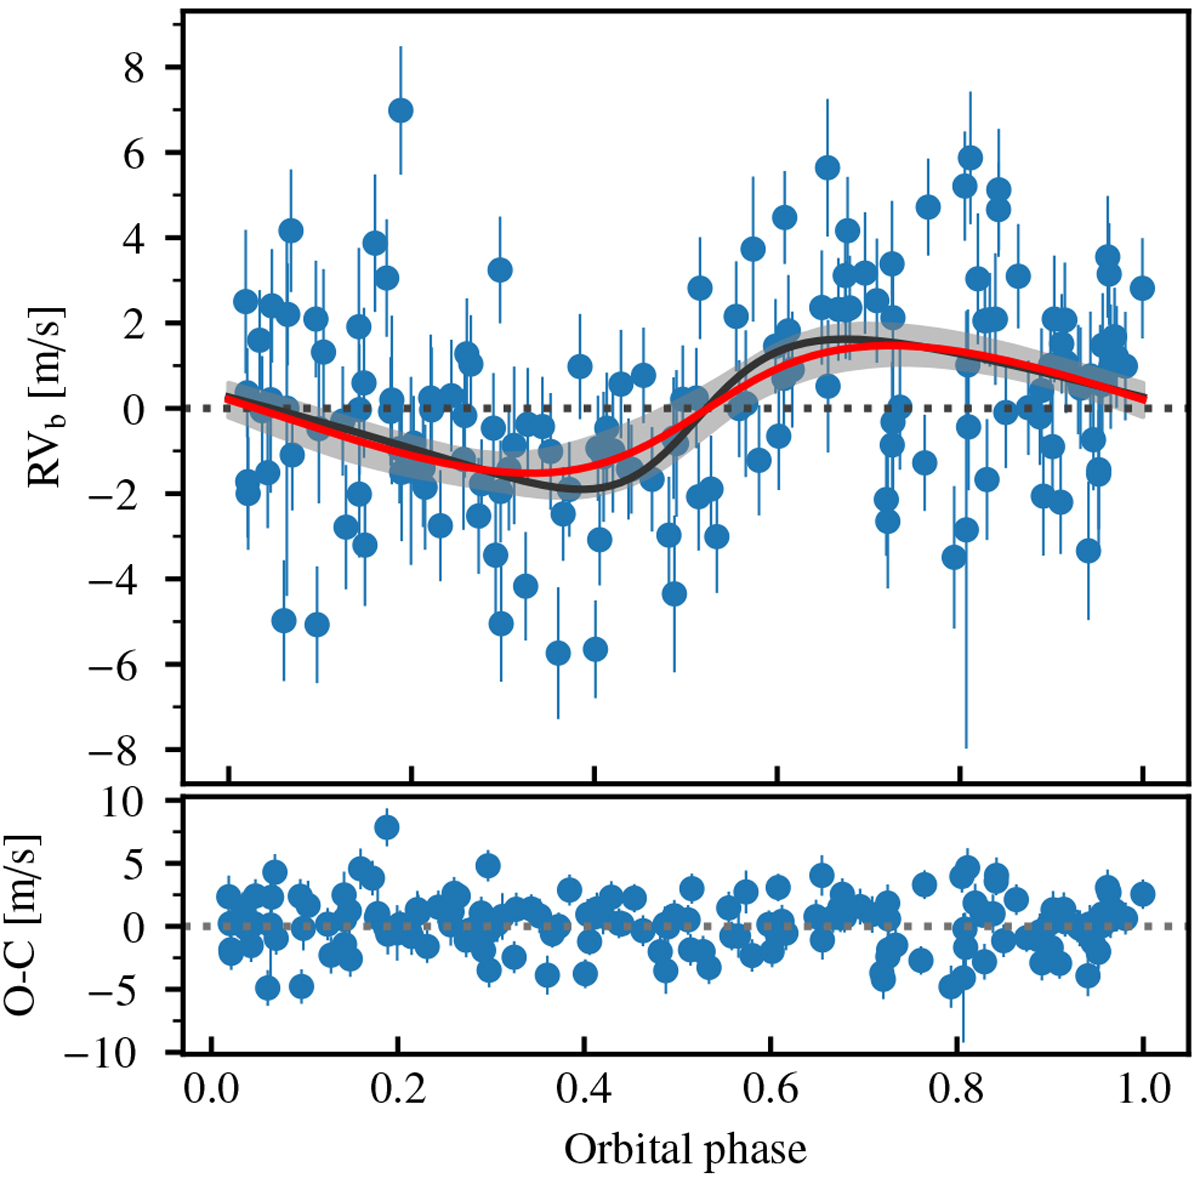
SOPHIE velocities, after subtraction of MAP-estimate model for the zero-point offset, secular acceleration and additional acceleration terms, and phase folded to the MAP-estimate of the Keplerian period, under the k1d1 hypothesis with correlated noise. The black and red curves represent the MAP-estimate and mean Keplerian model over the posterior samples obtained with the MCMC algorithm. The shaded region extends between the 5th- and 95th-percentile model curves, computed over 10 000 randomly chosen posterior samples.
Current usage metrics show cumulative count of Article Views (full-text article views including HTML views, PDF and ePub downloads, according to the available data) and Abstracts Views on Vision4Press platform.
Data correspond to usage on the plateform after 2015. The current usage metrics is available 48-96 hours after online publication and is updated daily on week days.
Initial download of the metrics may take a while.