Fig. 6
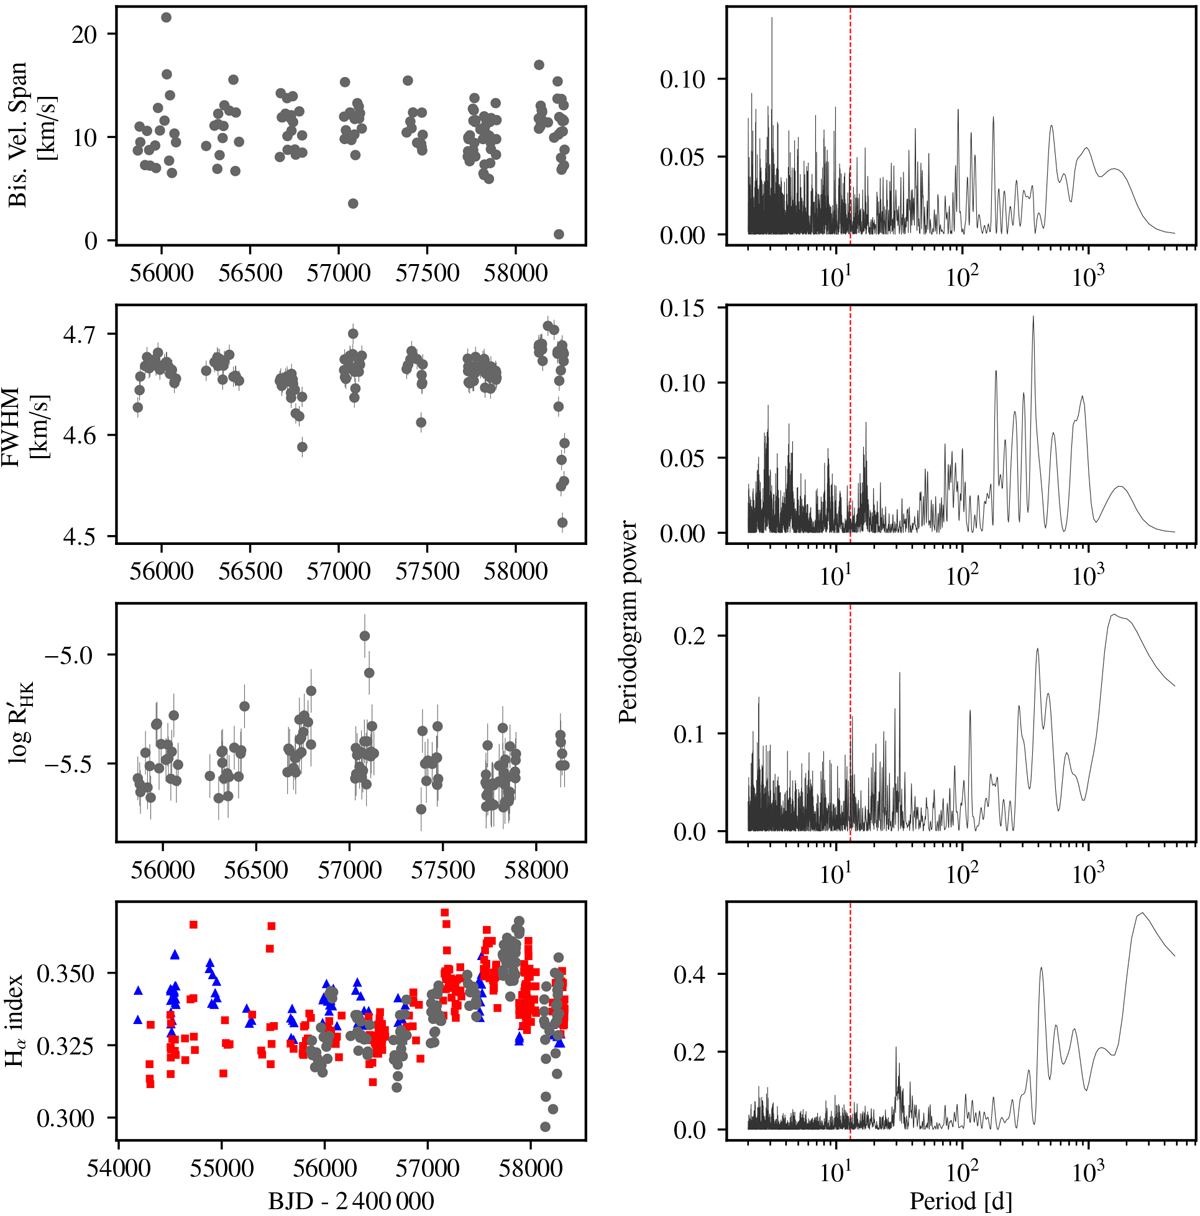
Time series (left panels) and GLS periodograms (right panels) of selected ancillary observables. The best-fit second order polynomials were subtracted from the Bisector Velocity Span and the FWHM time series. The red vertical lines in the periodograms indicate the frequency of the detected planet candidate. In the Hα time series, we also present the data corresponding to two other SP3 targets (see text for details): blue triangles for Gl 514and red squares for Gl 686. A version of the periodograms using a linear frequency scale in the x-axis is provided in Appendix A (Fig. A.2).
Current usage metrics show cumulative count of Article Views (full-text article views including HTML views, PDF and ePub downloads, according to the available data) and Abstracts Views on Vision4Press platform.
Data correspond to usage on the plateform after 2015. The current usage metrics is available 48-96 hours after online publication and is updated daily on week days.
Initial download of the metrics may take a while.