Fig. 4
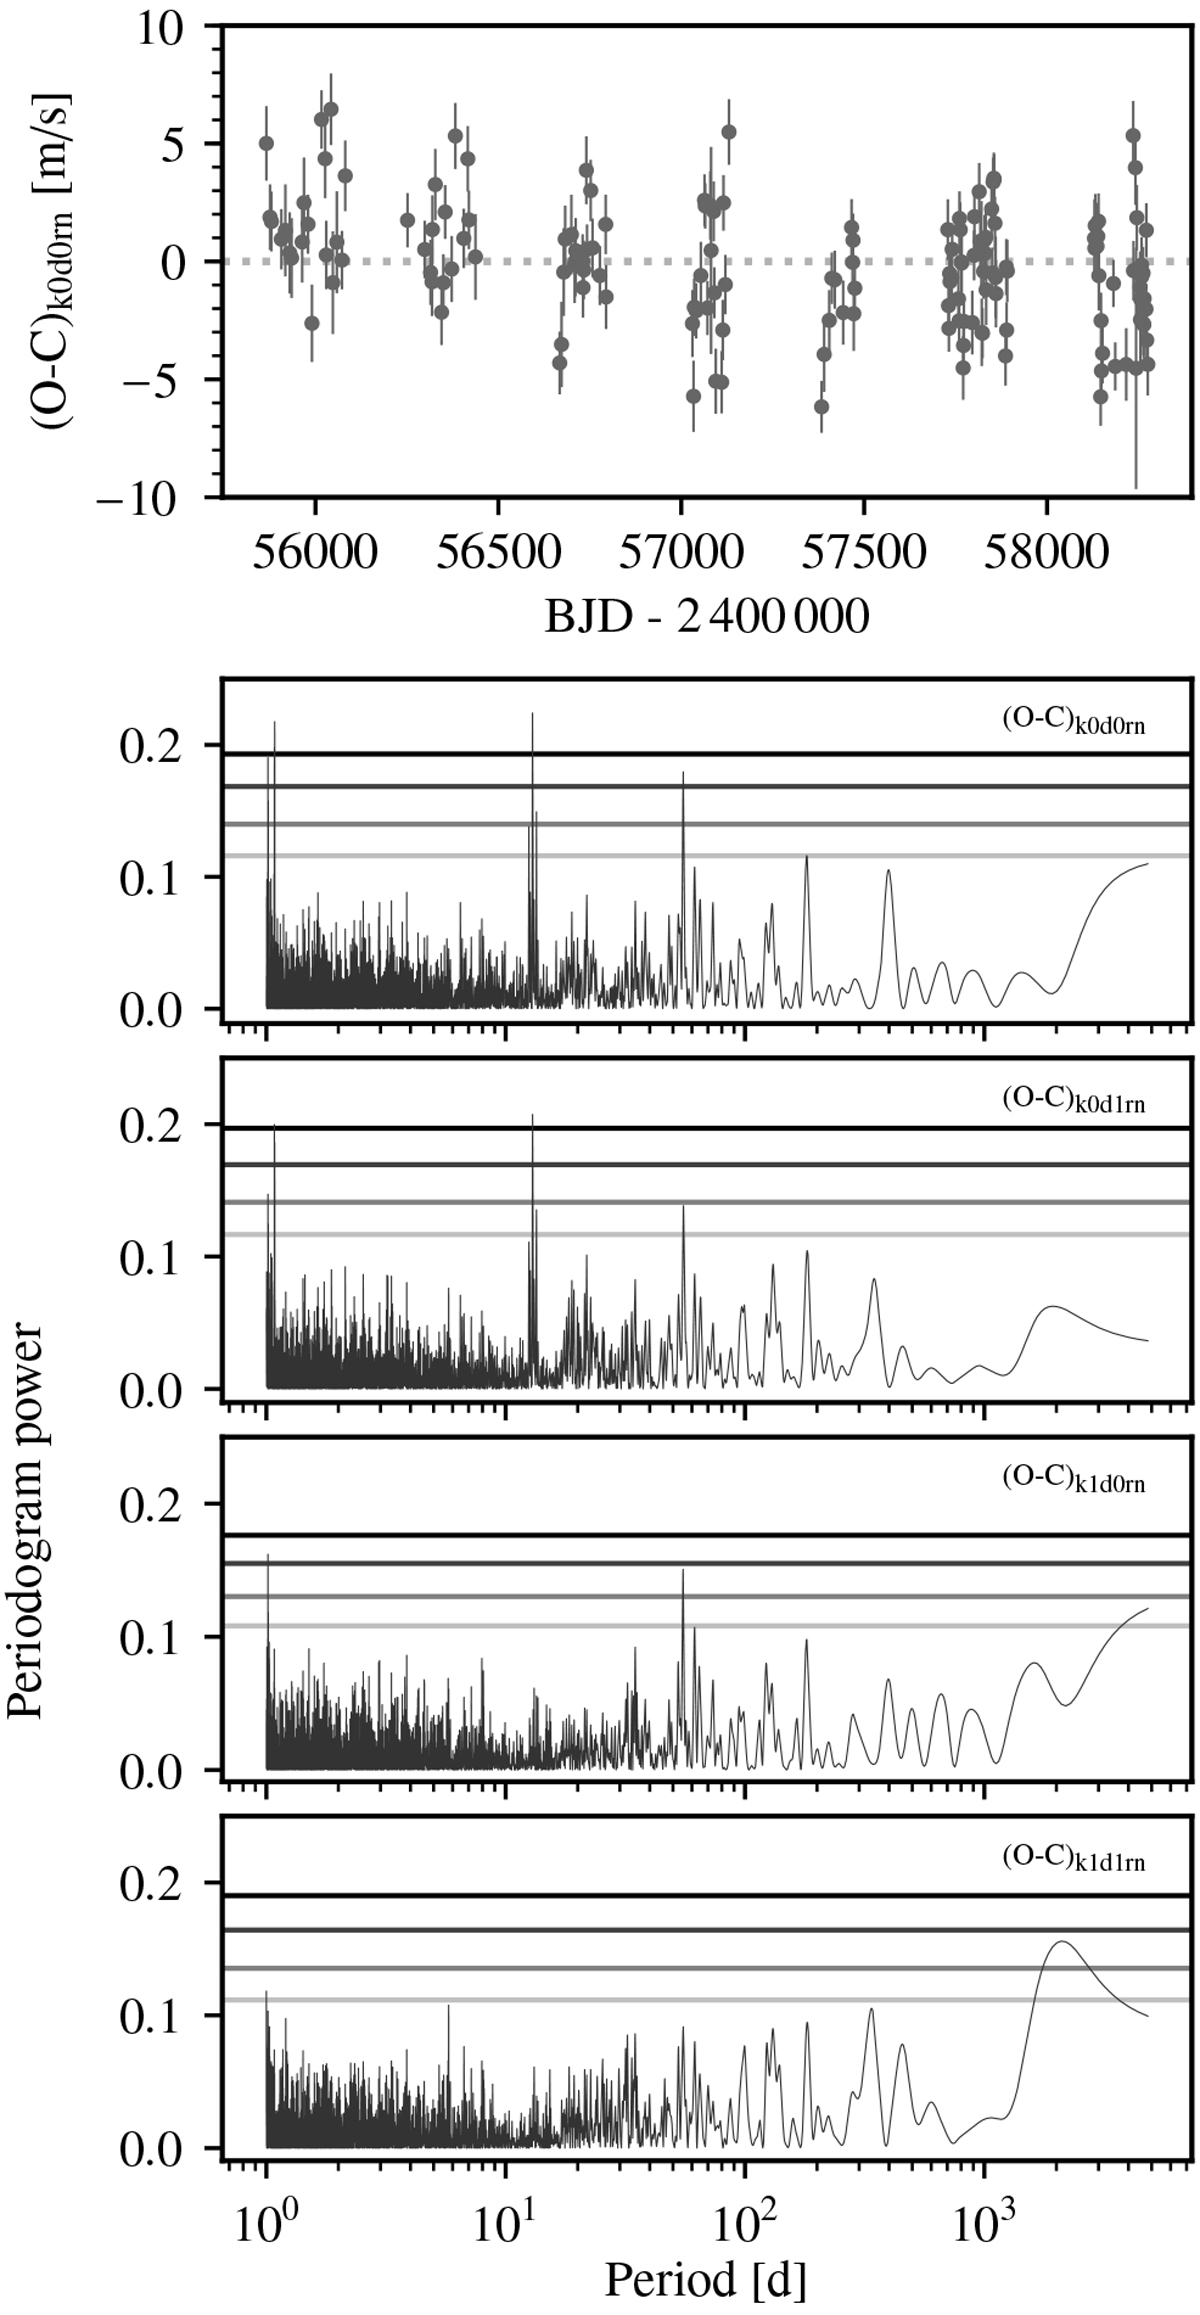
Radial velocity residuals of the MAP-estimate k0d0rn model (top panel), and generalised Lomb Scargle periodograms under the red noise models. The horizontal lines in the periodogram panels correspond to p-value levels of 0.5, 0.1, 0.01, and 1 × 10⁻³, from bottom to top, and are computed for each dataset by bootstrapping (see text for details). Second from top panel: GLS of radial velocities after zero-point correction and removal of secular acceleration term, that is the residuals of the k0d0model shown in the top panel; third from top panel: residuals of k0d1 model, containing an additional constant acceleration; second from bottom panel: residuals of the k1d0 model, with a Keplerian curve of period P = 12.9438 days; bottom panel: as above, but including also a linear acceleration term in the model (model k1d1). A version of the periodograms using a linear frequency scale in the x-axis is provided in Appendix A (Fig. A.1).
Current usage metrics show cumulative count of Article Views (full-text article views including HTML views, PDF and ePub downloads, according to the available data) and Abstracts Views on Vision4Press platform.
Data correspond to usage on the plateform after 2015. The current usage metrics is available 48-96 hours after online publication and is updated daily on week days.
Initial download of the metrics may take a while.