Fig. 2
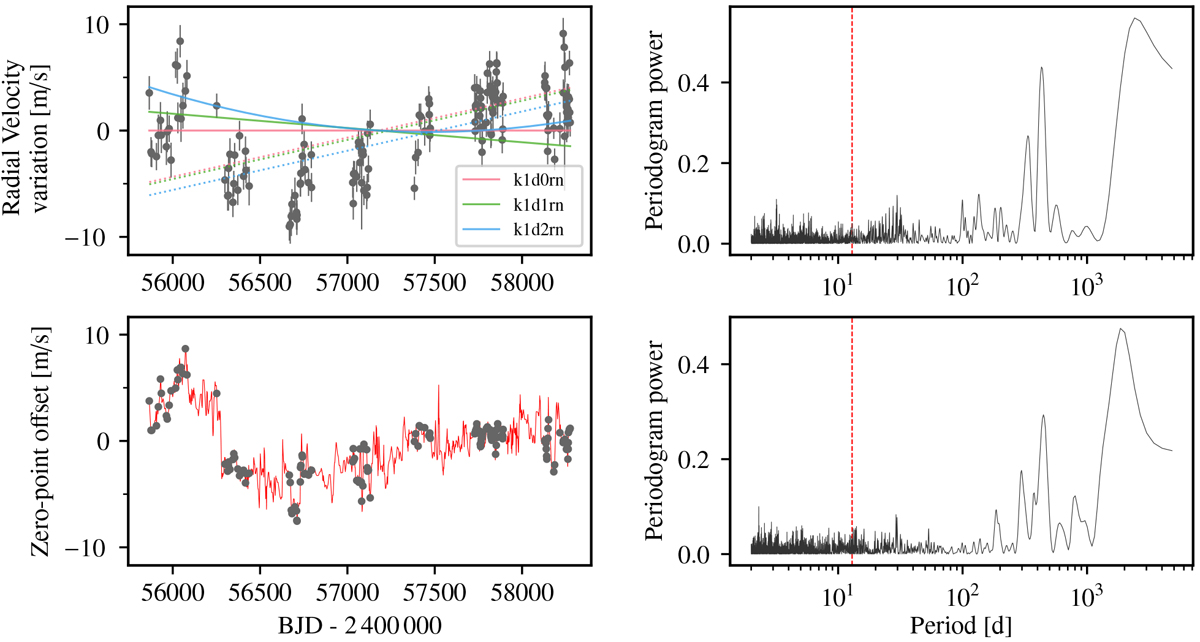
SOPHIE velocities and zero-point offset (upper left and lower left panels, respectively) with their corresponding GLS periodograms (right panels). Upper left panel: the solid and dashed curves represent the additional acceleration and secular (projection) acceleration terms under the three models with largest Bayesian evidence. Lower left panel: the thin red line is the spline interpolation of the zero-point shifts measured on a number of standard stars (see text for details), while the points represent the interpolation evaluated at the epochs of the velocity measurements. Right panels: in the periodograms of SOPHIE raw radial velocities of Gl 411 and zero-point offset of the spectrograph, the vertical red lines mark the frequency of the detected periodic signal.
Current usage metrics show cumulative count of Article Views (full-text article views including HTML views, PDF and ePub downloads, according to the available data) and Abstracts Views on Vision4Press platform.
Data correspond to usage on the plateform after 2015. The current usage metrics is available 48-96 hours after online publication and is updated daily on week days.
Initial download of the metrics may take a while.