Fig. 13
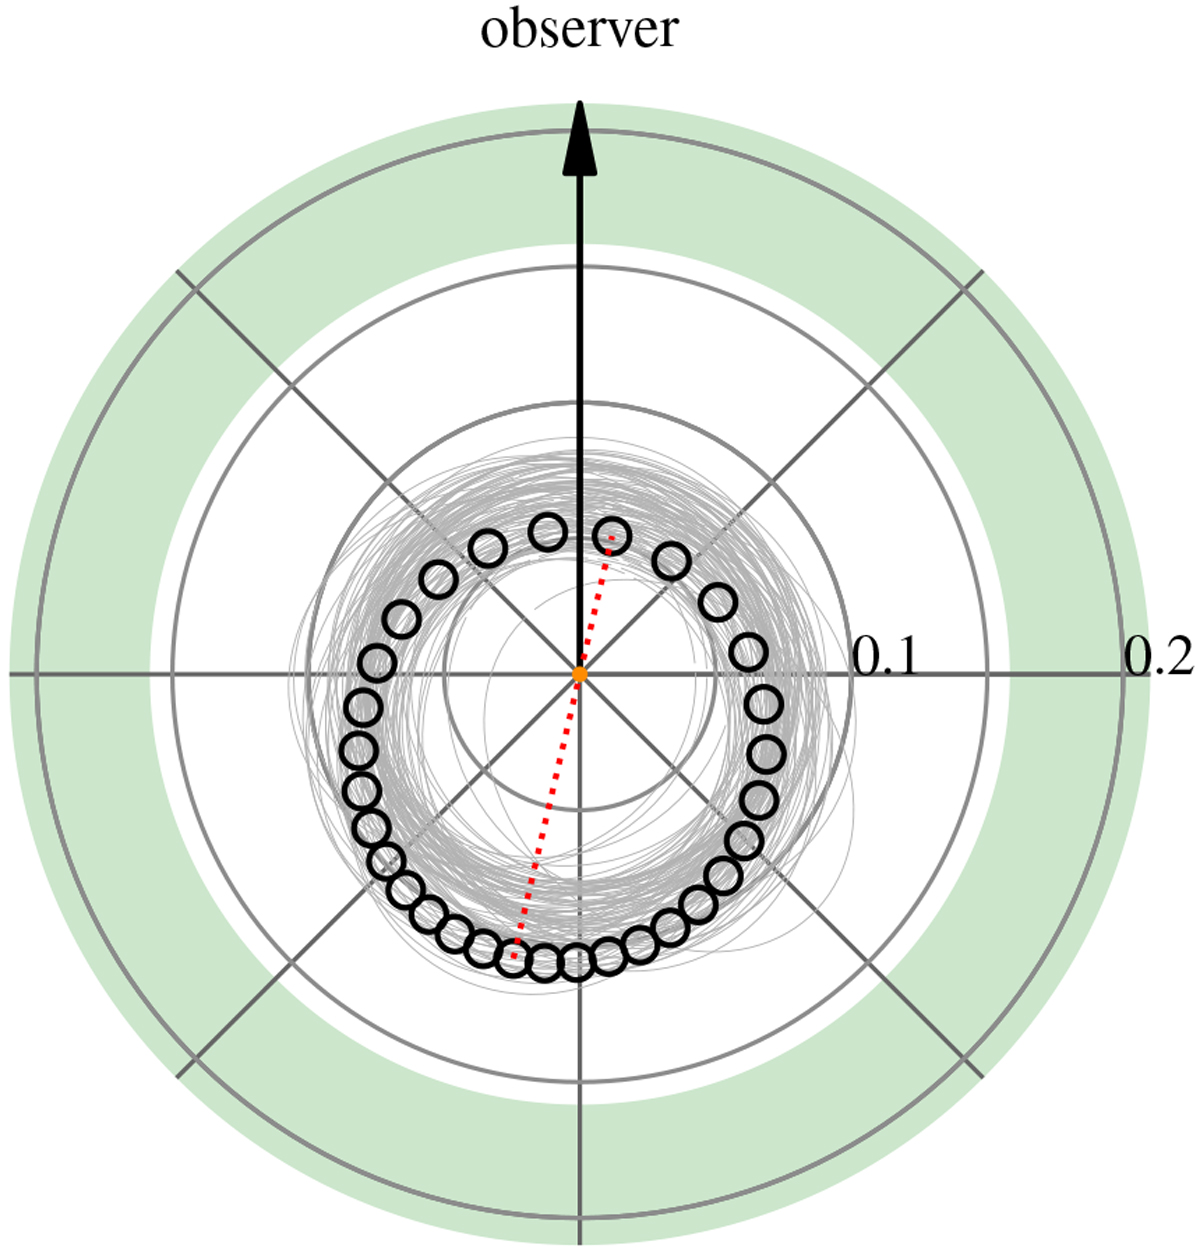
Sketch of the orbit of Gl 411 b, seen from above the orbital plane. The maximum-a-posteriori orbit is indicated with the empty black points that are equally spaced in time over the orbit, and the corresponding major axis is represented by the thin dotted red line. The thin grey lines are a hundred random samples from the merged posterior distributions (see text for details). The host star is at the centre, represented by an orange circle, whose size is to scale. The concentric circles are labelled in astronomical units and the black thick arrow points towards the observer. The filled green area is the inner region of the habitable zone, computed according to Kopparapu et al. (2013). The planet orbits the star too close to be habitable.
Current usage metrics show cumulative count of Article Views (full-text article views including HTML views, PDF and ePub downloads, according to the available data) and Abstracts Views on Vision4Press platform.
Data correspond to usage on the plateform after 2015. The current usage metrics is available 48-96 hours after online publication and is updated daily on week days.
Initial download of the metrics may take a while.