Free Access
Fig. 10
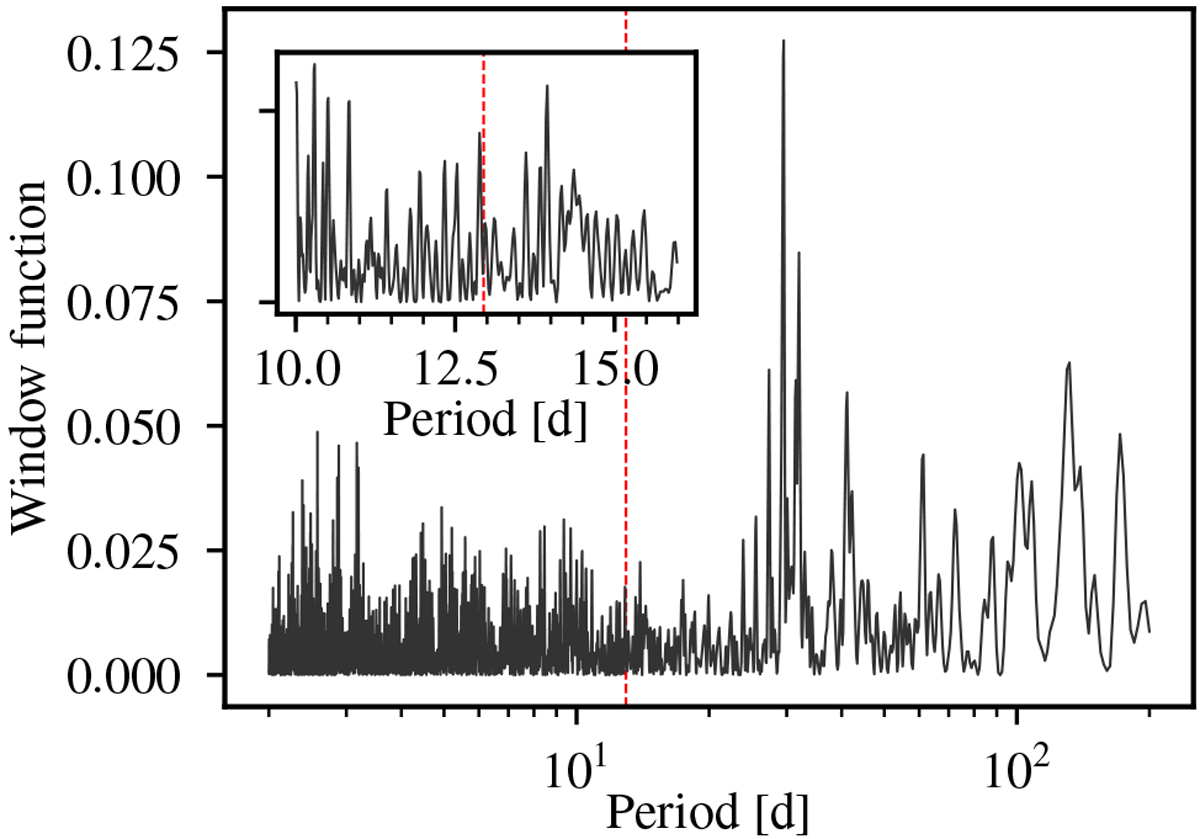
Window function of the SOPHIE observations for periods between 2 and 200 days. The largest peaks in the main panel correspond to the Moon synodic period. In the inset panel we present a zoom around the MAP planet period, indicated in both axes by a vertical dashed line.
Current usage metrics show cumulative count of Article Views (full-text article views including HTML views, PDF and ePub downloads, according to the available data) and Abstracts Views on Vision4Press platform.
Data correspond to usage on the plateform after 2015. The current usage metrics is available 48-96 hours after online publication and is updated daily on week days.
Initial download of the metrics may take a while.