Fig. 1
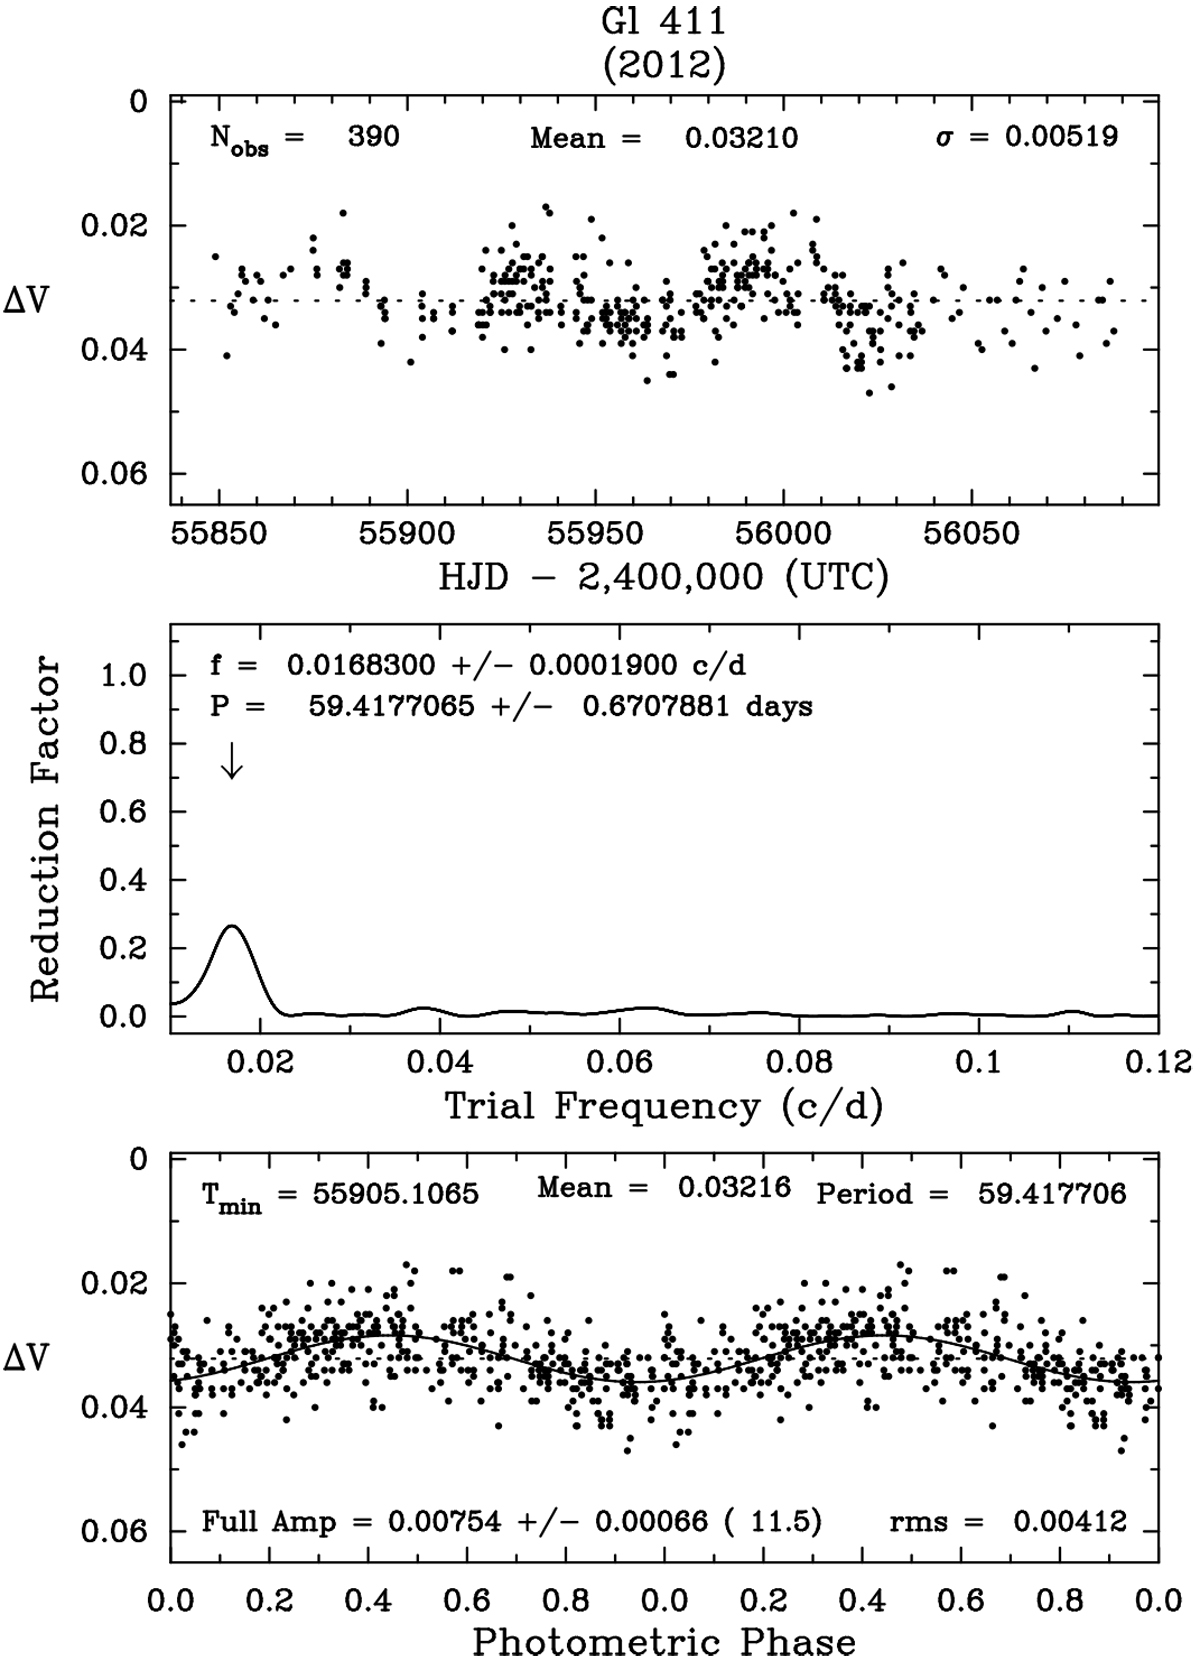
Top panel: Johnson V photometry of Gl 411 from the 2012 observing season, acquired with the TSU T3 0.40 m APT at Fairborn Observatory. Middle panel: frequency spectrum of the 2012 V observations of Gl 411. The best frequency occurs at 0.01683 ± 0.00019 cycles day−1, corresponding to a best period of 59.42 ± 0.67 days. Bottom panel: 2012 V observationsphased with the best period of 59.42 days. The phase curve shows coherent variability with a peak-to-peak amplitude of 0.0075 mag, which we take to be rotational modulation of photospheric spots. Seven of the eight observing seasons exhibit similar modulation (see Table B.1).
Current usage metrics show cumulative count of Article Views (full-text article views including HTML views, PDF and ePub downloads, according to the available data) and Abstracts Views on Vision4Press platform.
Data correspond to usage on the plateform after 2015. The current usage metrics is available 48-96 hours after online publication and is updated daily on week days.
Initial download of the metrics may take a while.