Fig. 8.
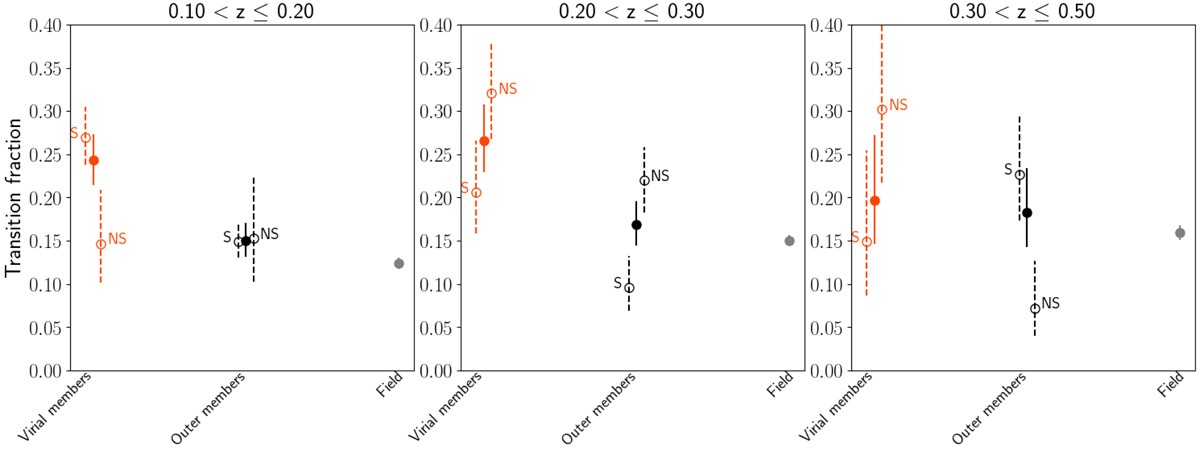
Fraction of galaxies in transition in the mass limited sample in the three redshift bins. Filled dots represent galaxies in the different environments, as written in the x-axis. The (S) and (NS) contribution to the virial and outer member populations are also represented with empty symbols and dashed error bars. Error bars are computed via bootstrapping.
Current usage metrics show cumulative count of Article Views (full-text article views including HTML views, PDF and ePub downloads, according to the available data) and Abstracts Views on Vision4Press platform.
Data correspond to usage on the plateform after 2015. The current usage metrics is available 48-96 hours after online publication and is updated daily on week days.
Initial download of the metrics may take a while.