Fig. 7.
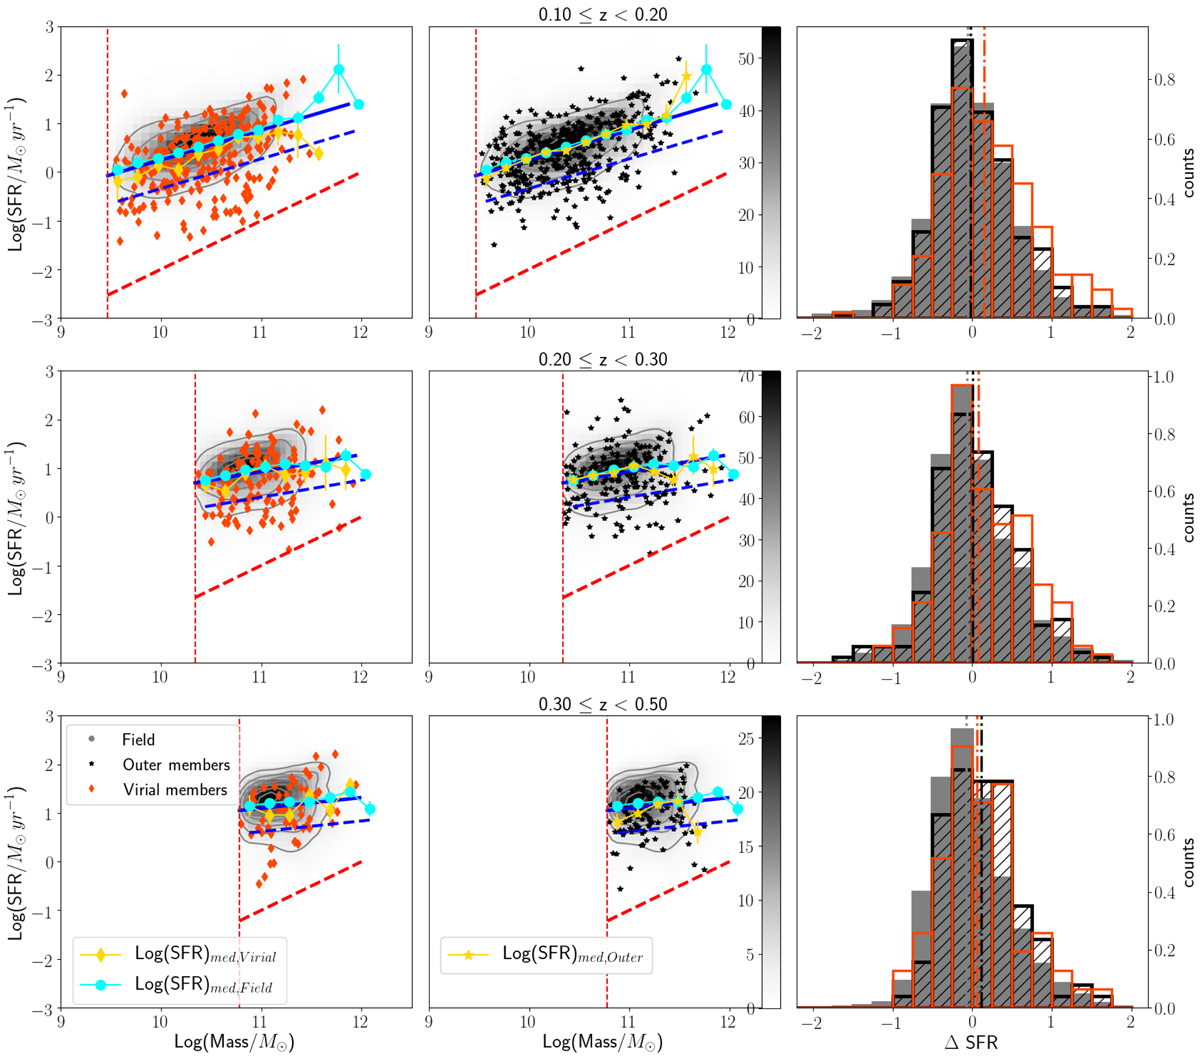
Left and middle panels: SFR–M⋆ relation for galaxies in the field and cluster virial and outer members (grey 2D histogram and density contours, orange diamonds, and black stars, respectively) in the mass limited sample. Panels in different lines refer to different redshift bins. The field population is represented with a 2D histogram whose values are given in the colour bar included in the middle panel, and grey contours trace the density levels of the data points. The vertical red dashed line shows the stellar mass limit at each redshift, while the oblique red dashed line sets the limit to the star-forming population, i.e. sSFR = 10−12 yr−1. The blue line is the linear fit to the SFR–M⋆ relation including all the environments at each redshift, and the dashed blue lines correspond to 1σ errors on the fitting line. The parameters of the fit and the values of σ are given in Table 5. The gold diamonds/stars and cyan dots represent the median SFR values computed in mass bins of 0.2 dex width, for the virial/outer members and field population, respectively. Error bars on the medians are computed assuming a normal distribution of the data points as 1.253![]() , where σ is the standard deviation of the distribution and n is the number of objects in the considered stellar mass bin. Right panels: histograms of the differences between the expected SFR computed using the main sequence fitting line at the stellar mass of any given galaxy in our sample and its actual SFR (ΔSFR). Positive values of ΔSFR indicate reduced SFR compared to the SFR main sequence of star-forming galaxies. The median values of the distributions are also shown with vertical dashed lines and different environments are colour coded as written in the legend.
, where σ is the standard deviation of the distribution and n is the number of objects in the considered stellar mass bin. Right panels: histograms of the differences between the expected SFR computed using the main sequence fitting line at the stellar mass of any given galaxy in our sample and its actual SFR (ΔSFR). Positive values of ΔSFR indicate reduced SFR compared to the SFR main sequence of star-forming galaxies. The median values of the distributions are also shown with vertical dashed lines and different environments are colour coded as written in the legend.
Current usage metrics show cumulative count of Article Views (full-text article views including HTML views, PDF and ePub downloads, according to the available data) and Abstracts Views on Vision4Press platform.
Data correspond to usage on the plateform after 2015. The current usage metrics is available 48-96 hours after online publication and is updated daily on week days.
Initial download of the metrics may take a while.