Fig. 6.
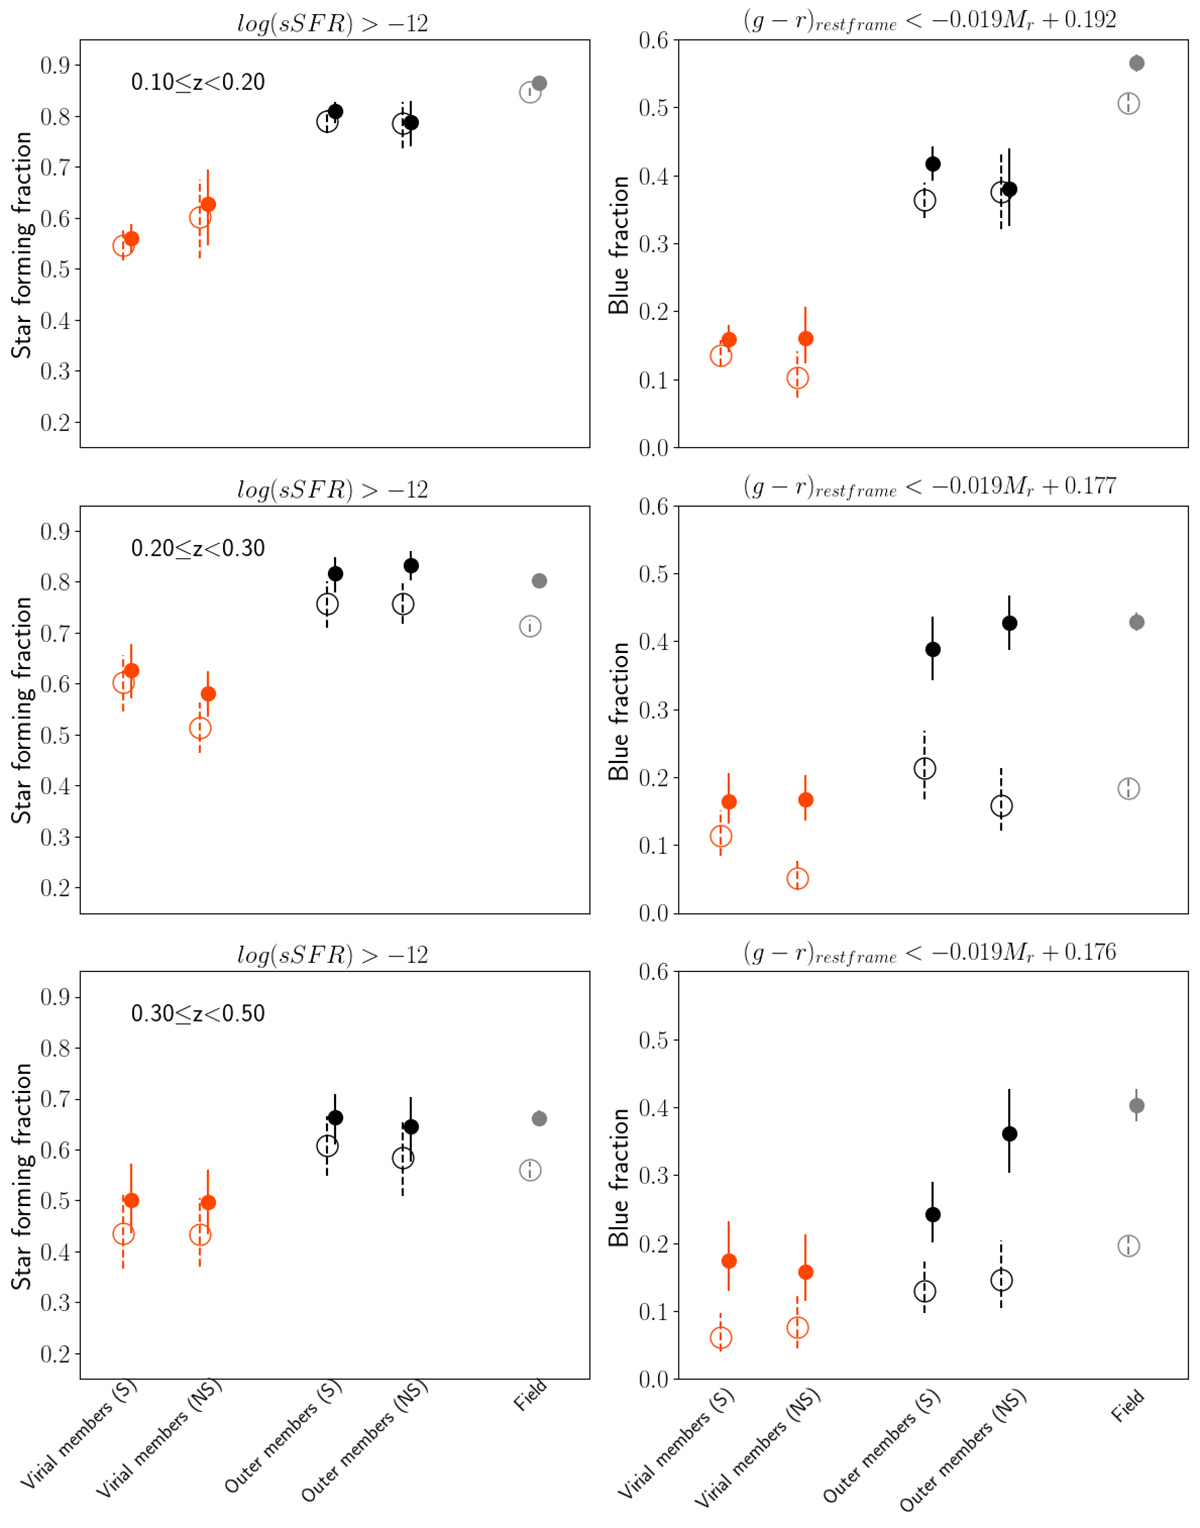
Fraction of star-forming (left) and blue (right) galaxies in different environments and different redshifts, as indicated in the panels. Cluster members are divided into four subsamples: virial and outer members that belong or do not belong to a supercluster. Values obtained using the magnitude limited sample are represented with filled symbols and solid errors, those obtained using the mass limited sample are represented by empty symbols and dashed error bars. A horizontal shift is applied for the sake of clarity. Errors are derived by means of a bootstrap method.
Current usage metrics show cumulative count of Article Views (full-text article views including HTML views, PDF and ePub downloads, according to the available data) and Abstracts Views on Vision4Press platform.
Data correspond to usage on the plateform after 2015. The current usage metrics is available 48-96 hours after online publication and is updated daily on week days.
Initial download of the metrics may take a while.