Fig. 13.
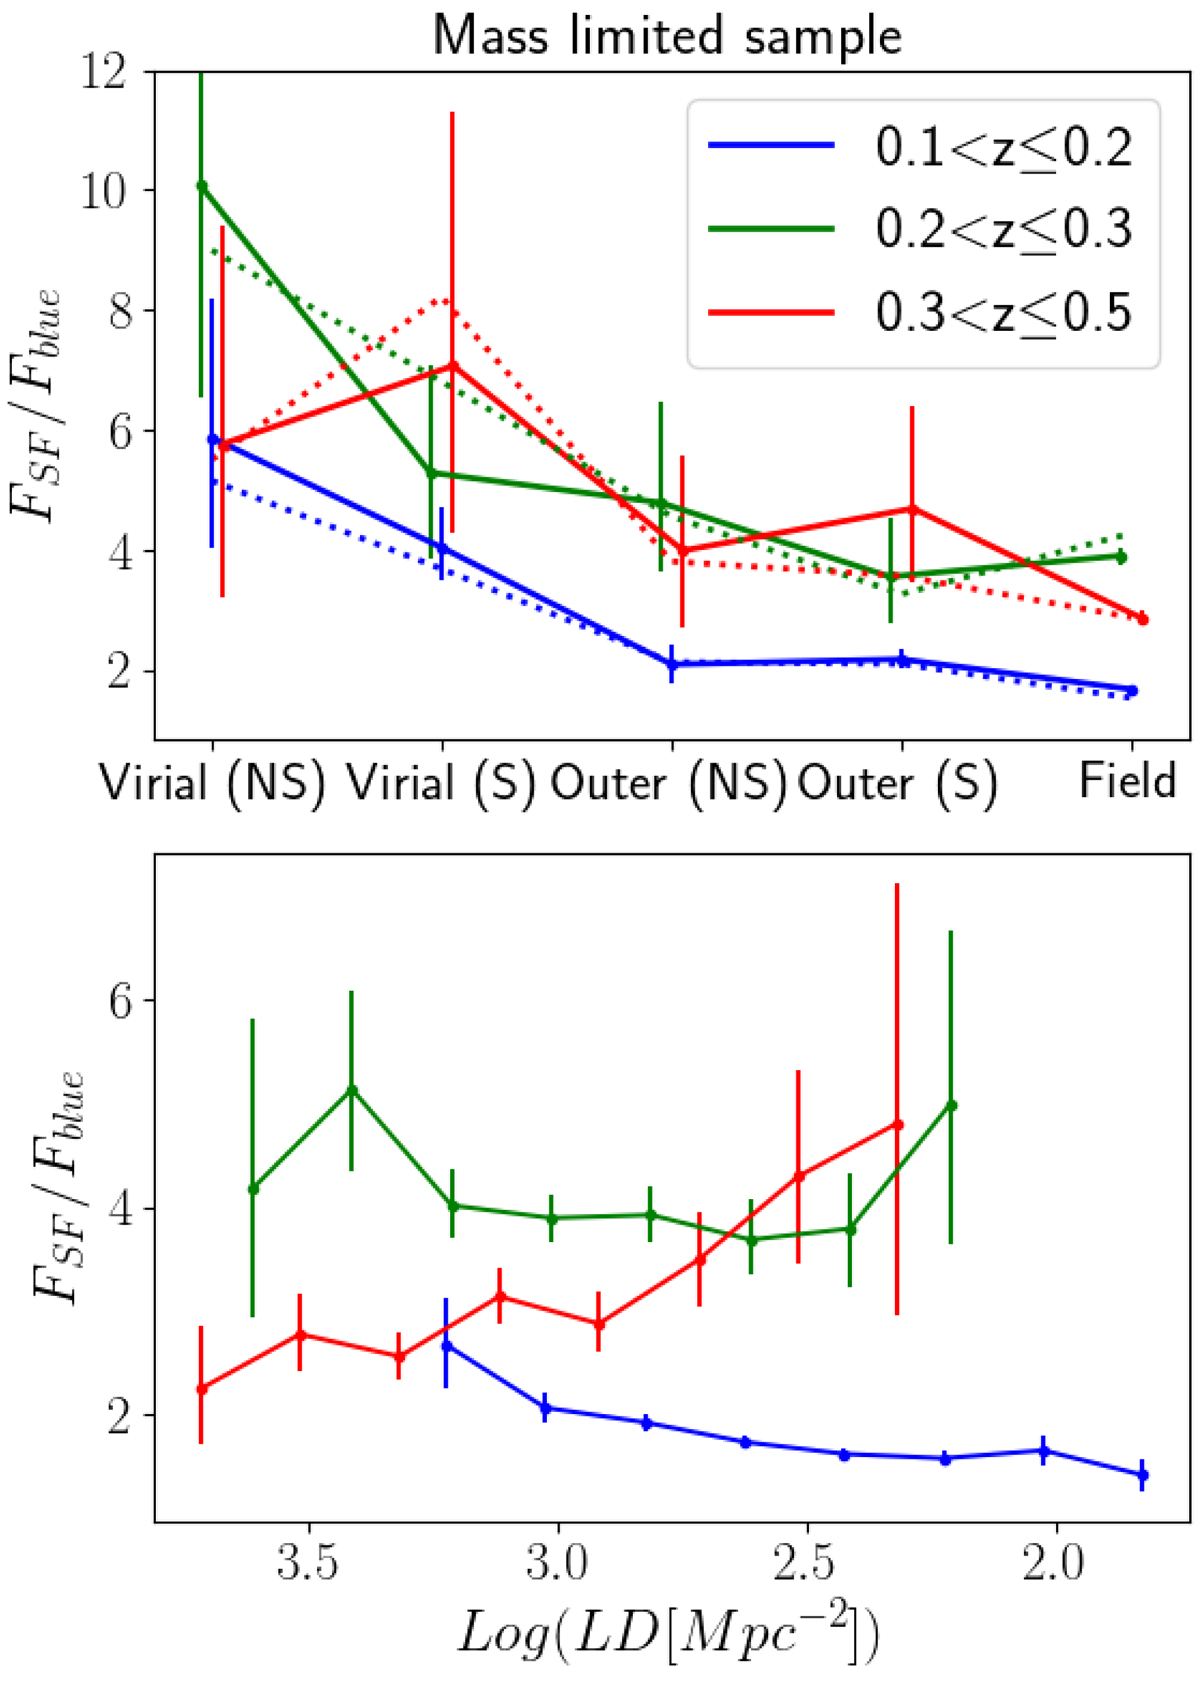
Ratio of the fraction of star-forming (FSFing) to blue (Fblue) galaxies in the mass limited sample in the three redshift bins and in different global (top) and local (bottom) environments. Dashed lines in the top panel show trends when AGNs are removed form the sample as explained in the Appendix B. In both panels, error bars are computed by propagating the asymmetric errors on the single fractions by means of the statistical error propagation.
Current usage metrics show cumulative count of Article Views (full-text article views including HTML views, PDF and ePub downloads, according to the available data) and Abstracts Views on Vision4Press platform.
Data correspond to usage on the plateform after 2015. The current usage metrics is available 48-96 hours after online publication and is updated daily on week days.
Initial download of the metrics may take a while.