Fig. 11.
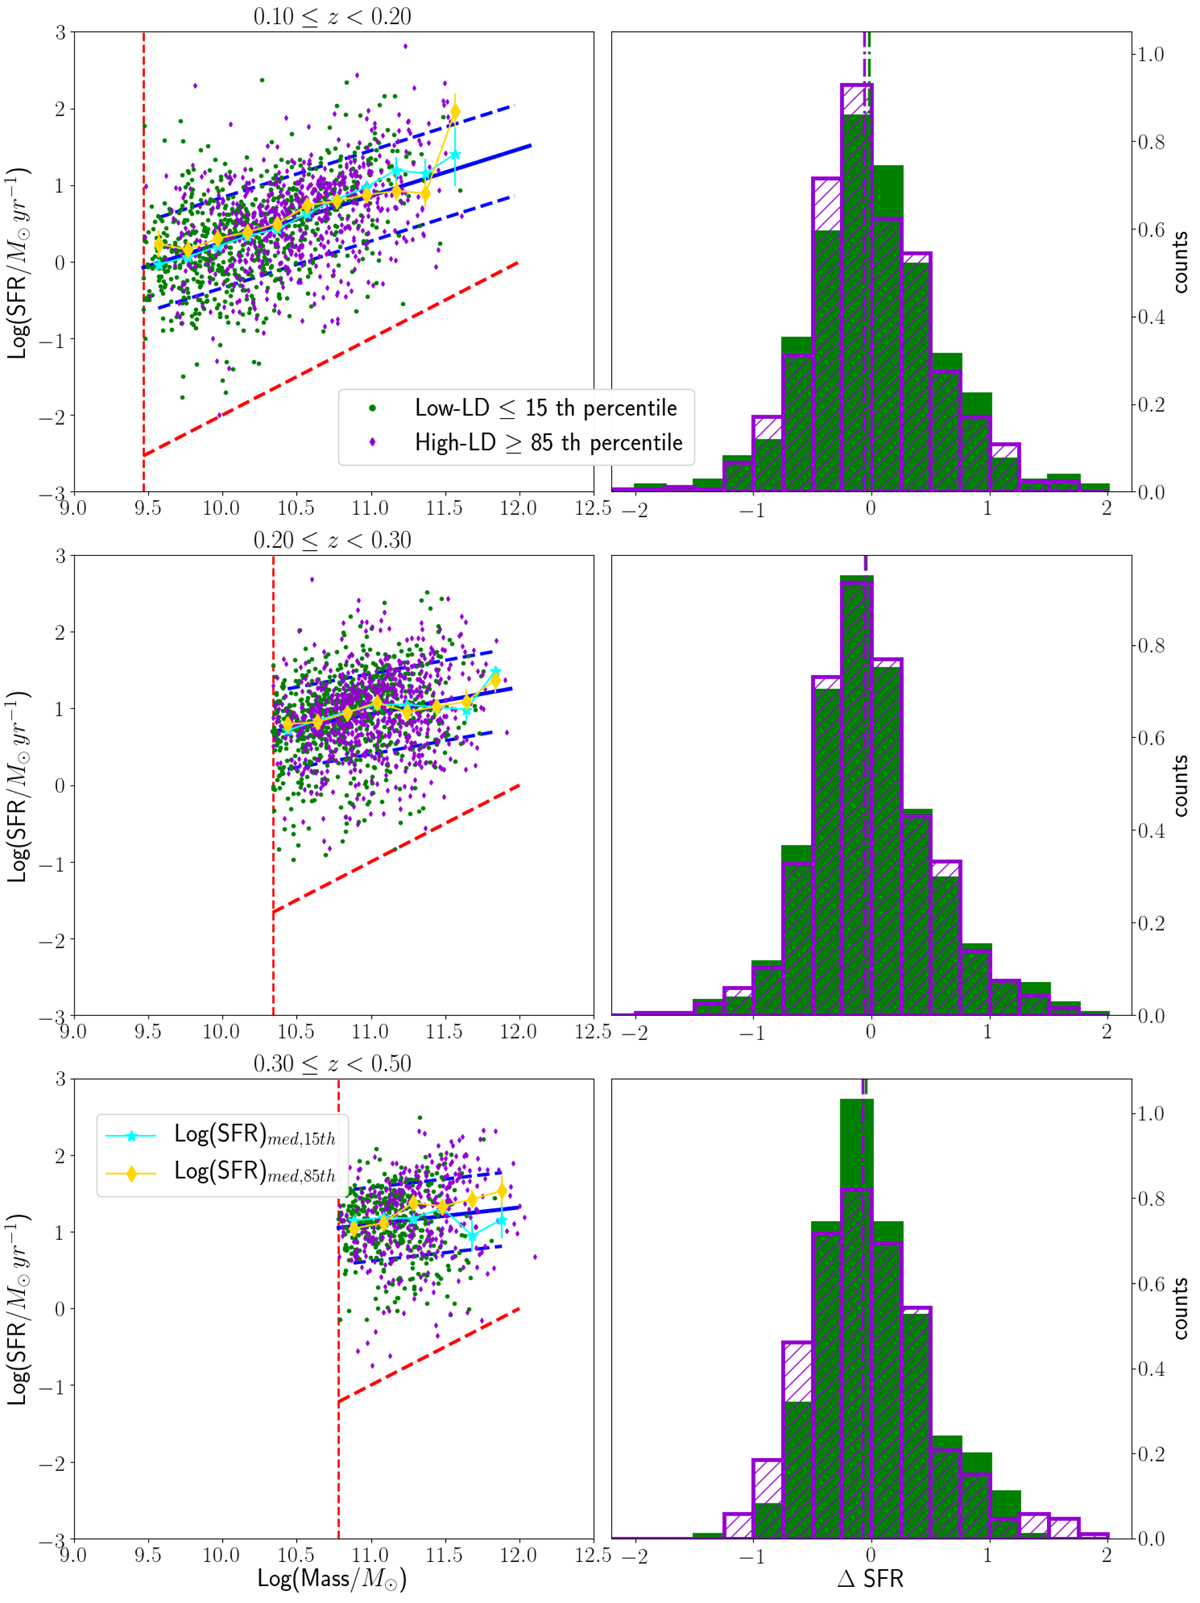
Left panels: SFR–M⋆ relation for galaxies in two regimes of LD, corresponding to the wings of the LD histograms shown in Fig. 9. Panels and lines are shown as Fig. 7. Cyan stars and the gold diamonds represent the median values of the SFR computed in 0.2 dex stellar mass bins, for the low- and high-LD regimes respectively. Error bars are computed as in Fig. 7. Right panels: histograms of the differences between the expected SFR computed using the main sequence fitting line at the stellar mass of any given galaxy in our sample and its actual SFR (ΔSFR). Median values of the distributions are shown with vertical dashed lines and colour coded as written in the legend.
Current usage metrics show cumulative count of Article Views (full-text article views including HTML views, PDF and ePub downloads, according to the available data) and Abstracts Views on Vision4Press platform.
Data correspond to usage on the plateform after 2015. The current usage metrics is available 48-96 hours after online publication and is updated daily on week days.
Initial download of the metrics may take a while.