Fig. 13.
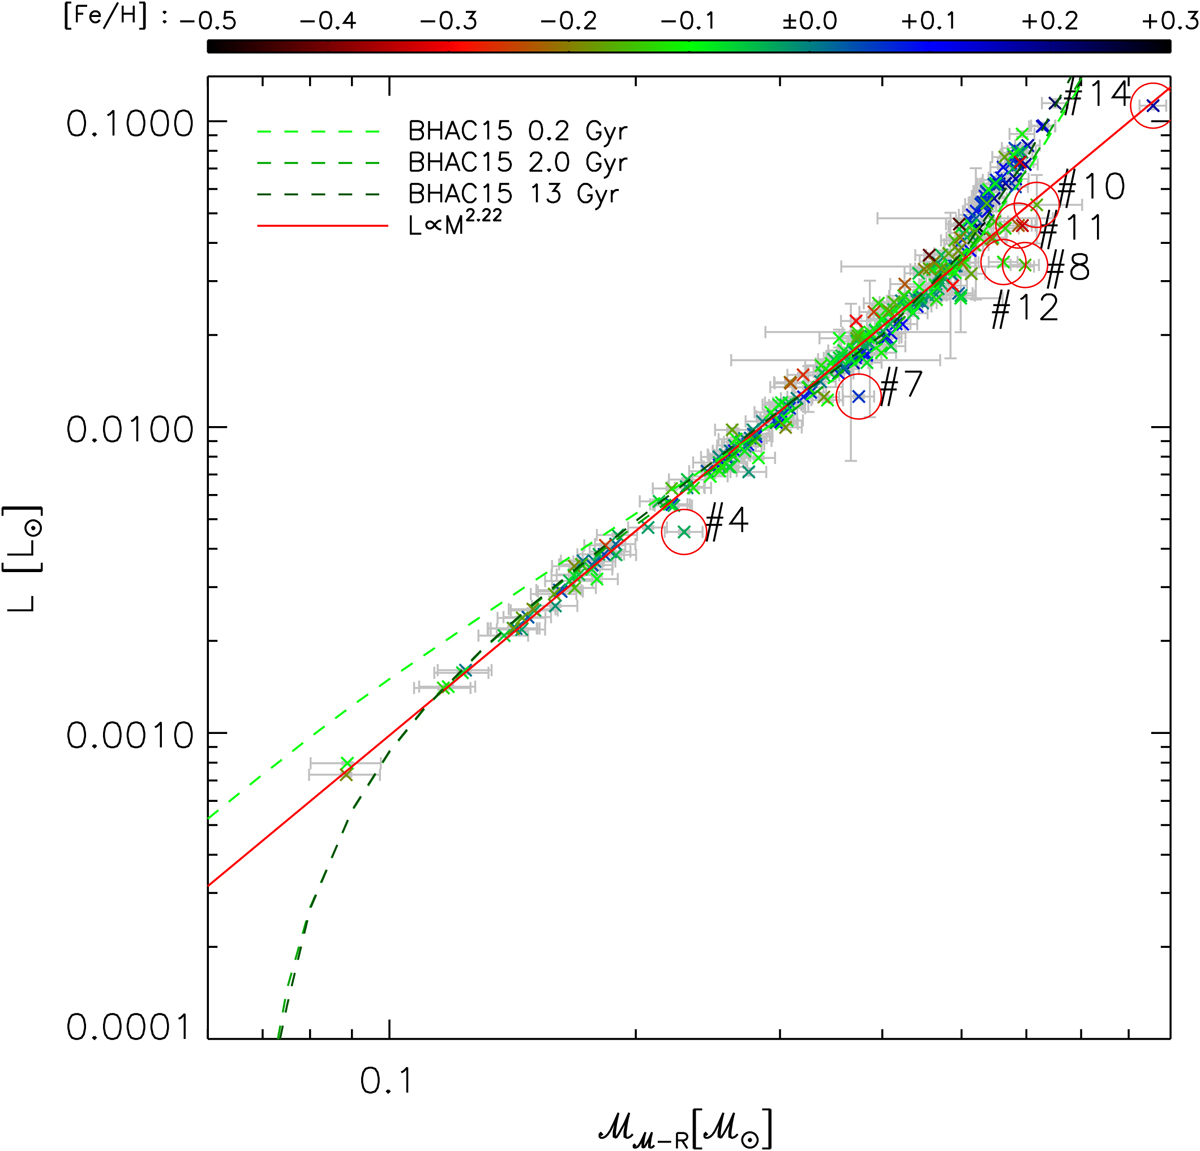
Mass-luminosity relation using L from Sect. 3.1 and ℳℳ−R from Sect. 3.4. The metallicities are color coded as indicated. For comparison we plot isochrones for 0.2, 2, and 13 Gyr (dashed lines in increasingly darker green) from BHAC15. The red solid line indicates the fit we obtained in Eq. (10) Obvious outliers, and stars discussed in reference to this figure in Sect. 5.2, are encircled: #4=GJ 1235 (J19216+208), #7=RX J0447.2+2038 (J04472+206), #8=1RXS J050156.7+010845 (J05019+011), #10=G 234-057 (J09133+688), #11=TYC 3529-1437-1 (J18174+483), #12=StKM 2-809 (J12156+526), and #14=K2-33 (J16102−193).
Current usage metrics show cumulative count of Article Views (full-text article views including HTML views, PDF and ePub downloads, according to the available data) and Abstracts Views on Vision4Press platform.
Data correspond to usage on the plateform after 2015. The current usage metrics is available 48-96 hours after online publication and is updated daily on week days.
Initial download of the metrics may take a while.