Fig. 5.
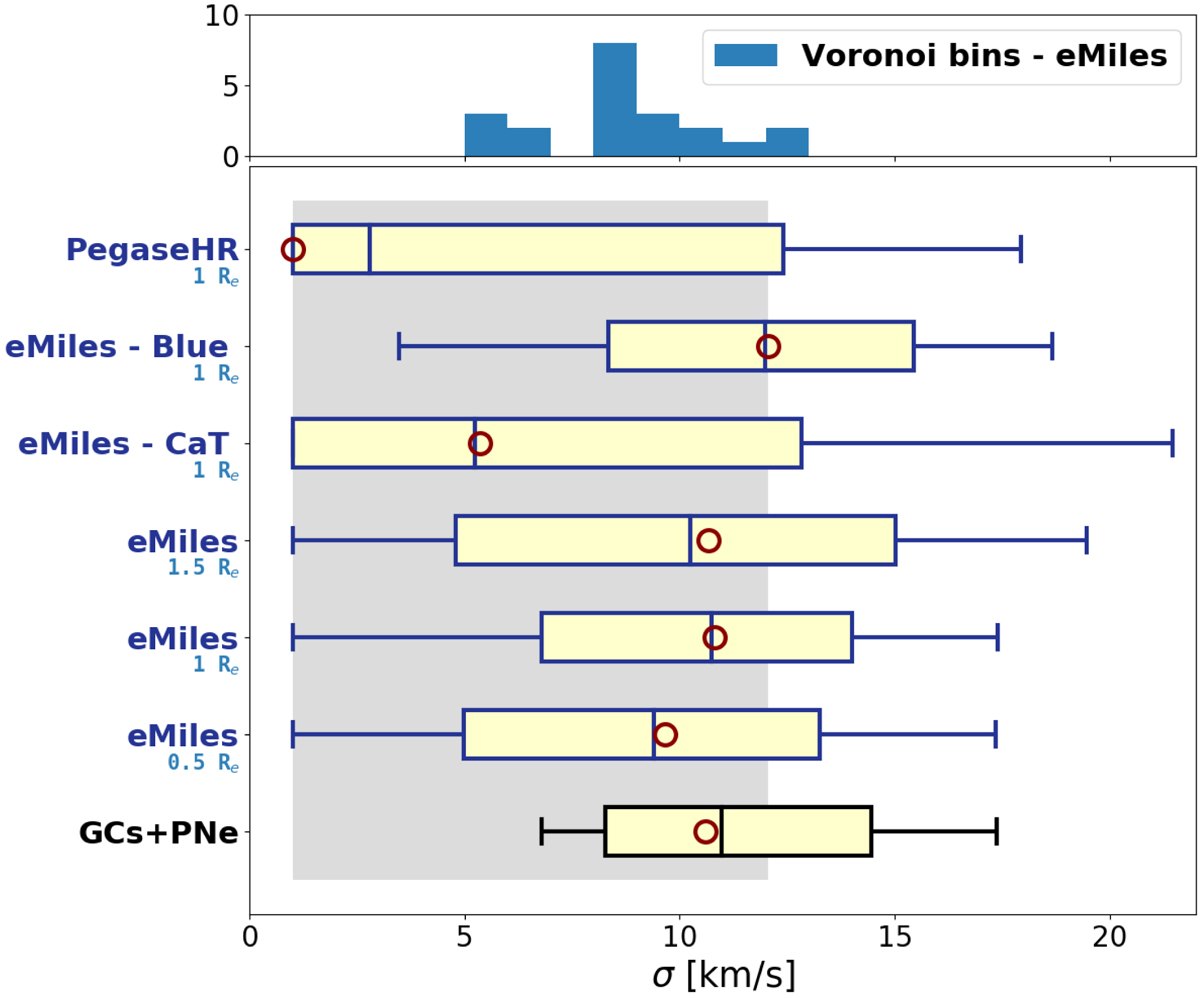
Stellar velocity dispersion values as measured from the MUSE spectra. Bottom panel: individual measurements for the three extracted apertures (0.5, 1.0, and 1.5 Re) mentioned in the text, when using different template libraries (eMiles or Pegase-HR) and different spectral coverage (around the Calcium triplet, or a “Blue” region – below 7000 Å). The red circles are the actual measurements, while the vertical bar shows the medians of the noise realisations. The extent of the boxes and whiskers correspond to the [16,84] and [2.5,97.5] percentiles, respectively. The line at the bottom labelled “GCs + PNe” indicates the values obtained via discrete tracers (see Sect. 4.1). The grey area illustrates the systematics by encompassing the various measurements. Top panel: histogram of the individual measurements for the 21 Voronoi bins, using the eMiles stellar templates.
Current usage metrics show cumulative count of Article Views (full-text article views including HTML views, PDF and ePub downloads, according to the available data) and Abstracts Views on Vision4Press platform.
Data correspond to usage on the plateform after 2015. The current usage metrics is available 48-96 hours after online publication and is updated daily on week days.
Initial download of the metrics may take a while.