Fig. 4.
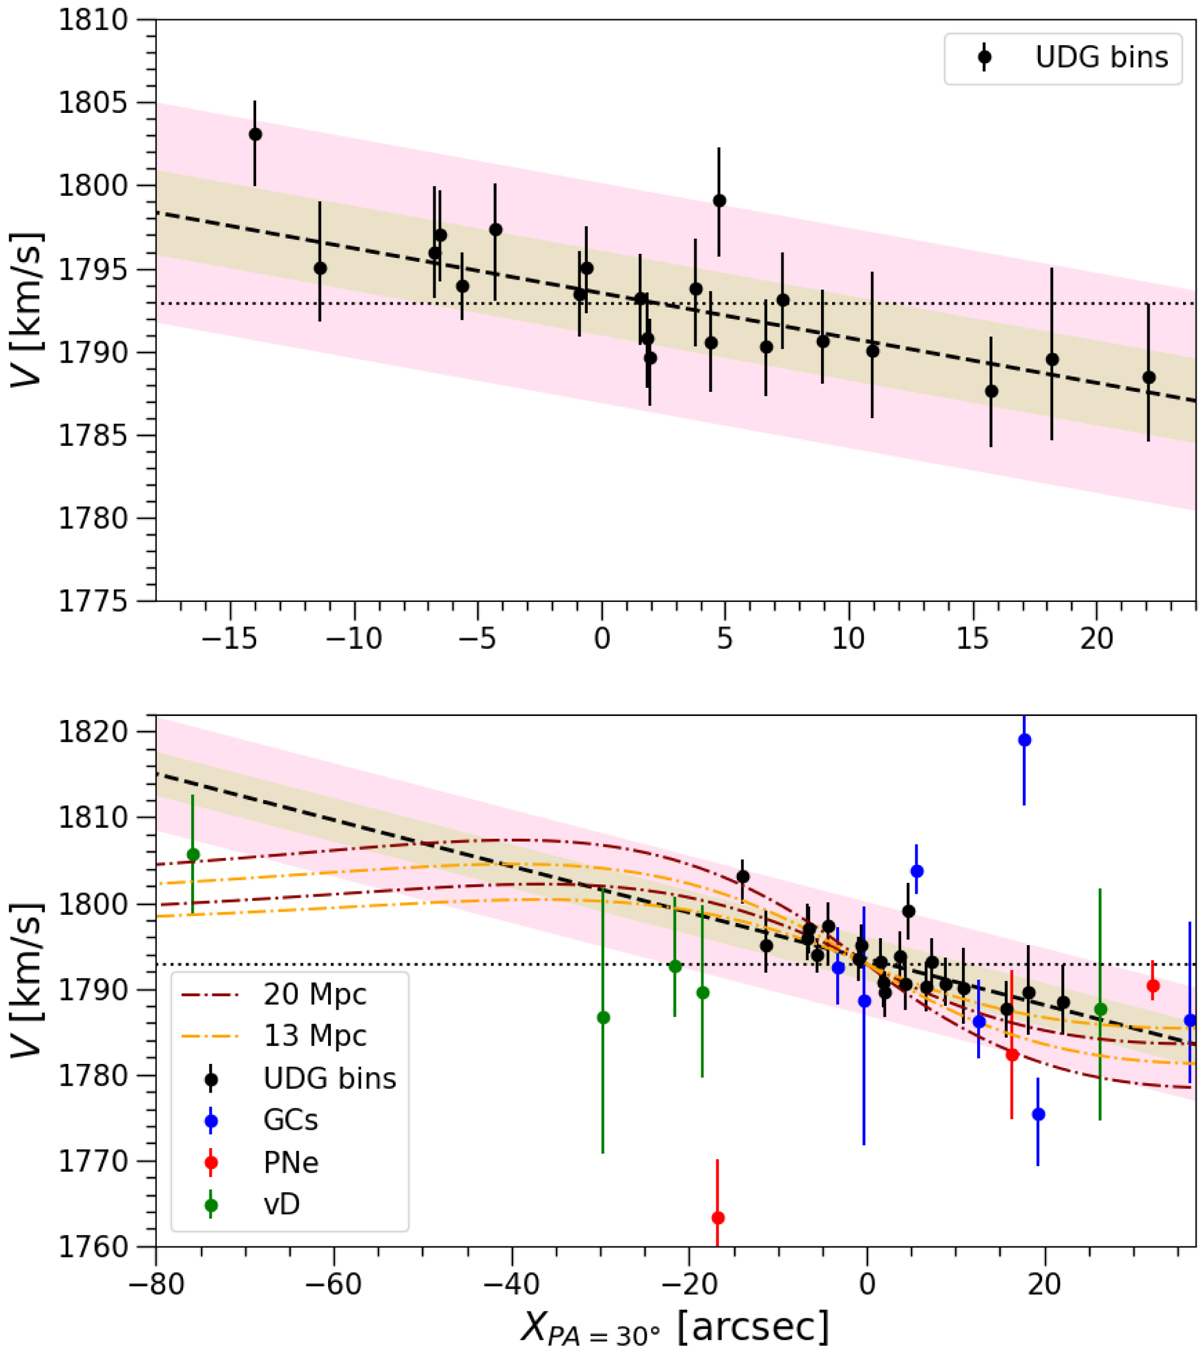
Stellar velocity field trend shown along a position angle of +30° for the DF2 Voronoi bins (in black). The dotted horizontal line shows the systemic velocity derived from the 1 Re elliptical aperture. The dashed line shows the best linear fit on the DF2 bins, with the residual scatters (1 and 2.6σ) scatter from the DF2 bins alone in shaded green and red. Measured clusters and PNe are respectively shown as blue and red points. Top panel: zoom within the MUSE field of view. Bottom panel: additional clusters measured by van Dokkum et al. (2018b), as well as reference circular velocity profiles from a Sérsic model at a distance of 20 or 13 Mpc with M/LV = 2, and for two different inclination angles (35 and 90°, see text).
Current usage metrics show cumulative count of Article Views (full-text article views including HTML views, PDF and ePub downloads, according to the available data) and Abstracts Views on Vision4Press platform.
Data correspond to usage on the plateform after 2015. The current usage metrics is available 48-96 hours after online publication and is updated daily on week days.
Initial download of the metrics may take a while.