Fig. 2.
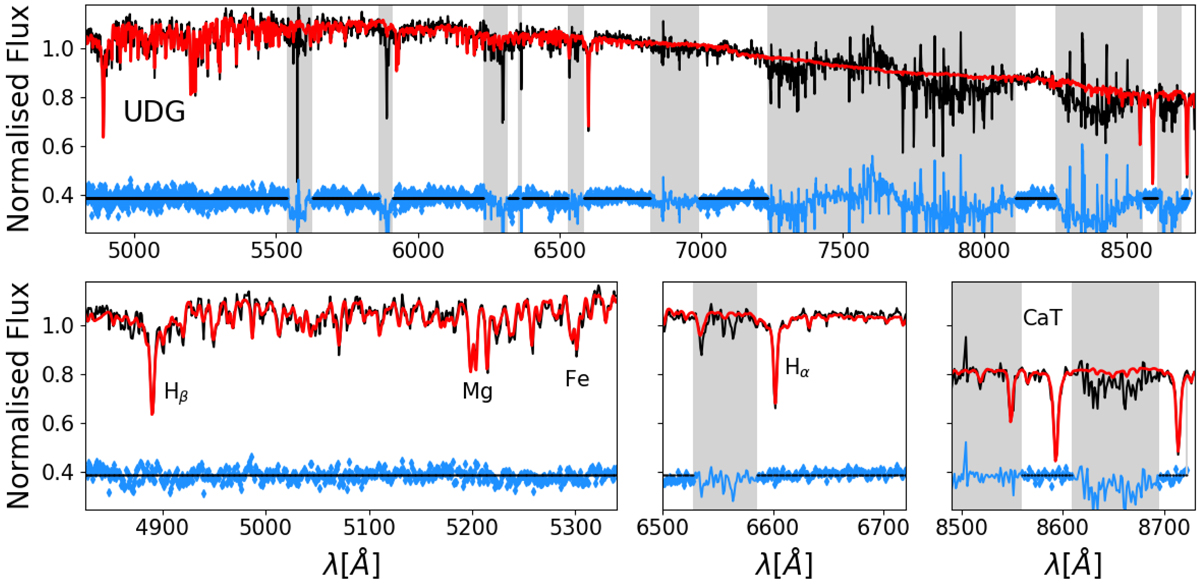
Spectrum of DF2 integrated over an aperture of 1 Re (black). The pPXF best fit is shown as a red line, while the residuals are shown as blue dots. Top panel: full MUSE spectral coverage, bottom three panels: zoomed versions around the main stellar absorption lines. Grey regions indicate wavelength ranges that have been excluded from pPXF fitting because of large sky line residuals.
Current usage metrics show cumulative count of Article Views (full-text article views including HTML views, PDF and ePub downloads, according to the available data) and Abstracts Views on Vision4Press platform.
Data correspond to usage on the plateform after 2015. The current usage metrics is available 48-96 hours after online publication and is updated daily on week days.
Initial download of the metrics may take a while.