Fig. 6
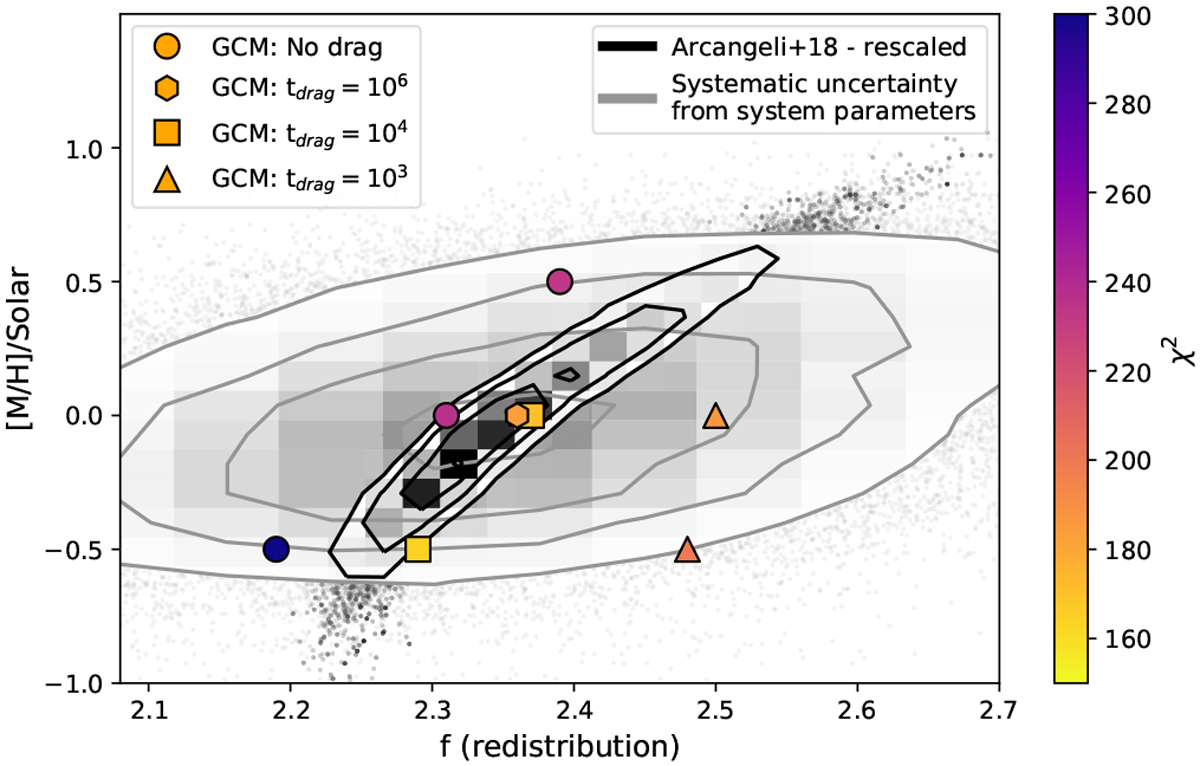
Metallicity as a function of redistribution efficiency, comparing 1D modelling to our 3D GCMs. The GCM outputs are shown by coloured markers, where marker styles indicate the drag strength in each model: from right to left tdrag = 103s (triangles), 104s (squares), 106 s (hexagon), and no-drag (circles). Markers are also coloured by χ2 between the corresponding GCM phase curve and our HST/WFC3 phase curve. Retrieved redistribution efficiencies from Arcangeli et al. (2018) are shown by black contours; the same contours, including a systematic uncertainty on the equilibrium temperature of 44 K, are shown in grey.
Current usage metrics show cumulative count of Article Views (full-text article views including HTML views, PDF and ePub downloads, according to the available data) and Abstracts Views on Vision4Press platform.
Data correspond to usage on the plateform after 2015. The current usage metrics is available 48-96 hours after online publication and is updated daily on week days.
Initial download of the metrics may take a while.