Fig. 3
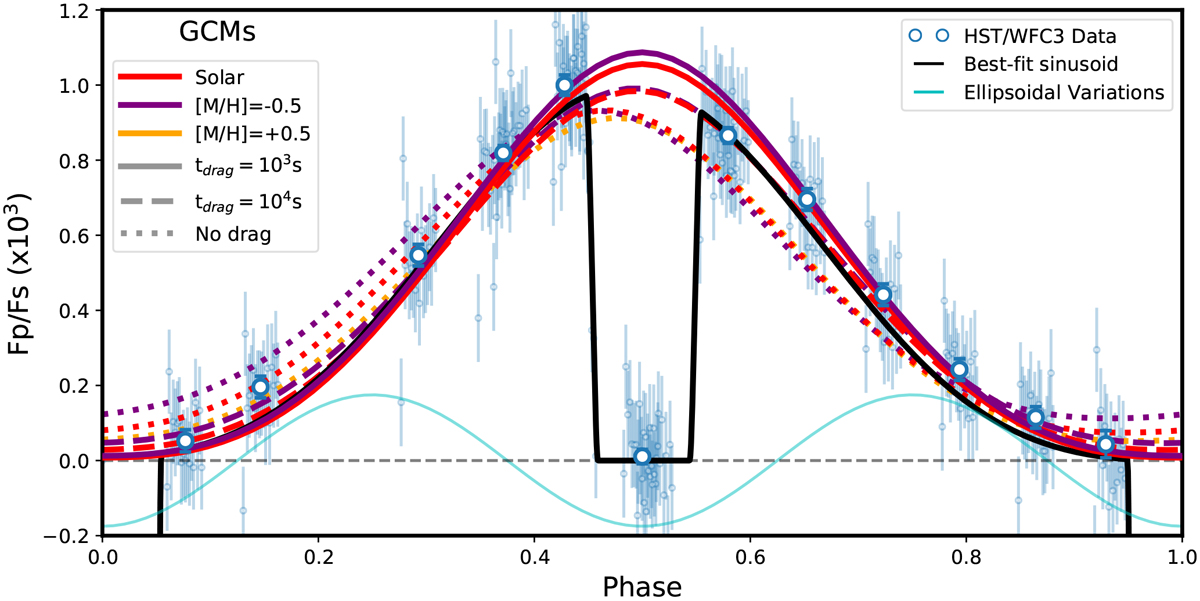
Systematics-corrected HST/WFC3 white-light phase curve of WASP-18b (blue points) compared to suite of GCMs (coloured curves). In black is the best-fit model used to parametrise the planet signal, with two sinusoidal components for the phase-curve variation. In cyan are the stellar ellipsoidal variations, that have been subtracted from the phase curve (see Sect. 3.2). GCMs shown are parametrised by 3 drag timescales indicated by line-styles and by 3 metallicities indicated by colours (−0.5, 0.0, and +0.5 relative to solar).
Current usage metrics show cumulative count of Article Views (full-text article views including HTML views, PDF and ePub downloads, according to the available data) and Abstracts Views on Vision4Press platform.
Data correspond to usage on the plateform after 2015. The current usage metrics is available 48-96 hours after online publication and is updated daily on week days.
Initial download of the metrics may take a while.