Fig. 2
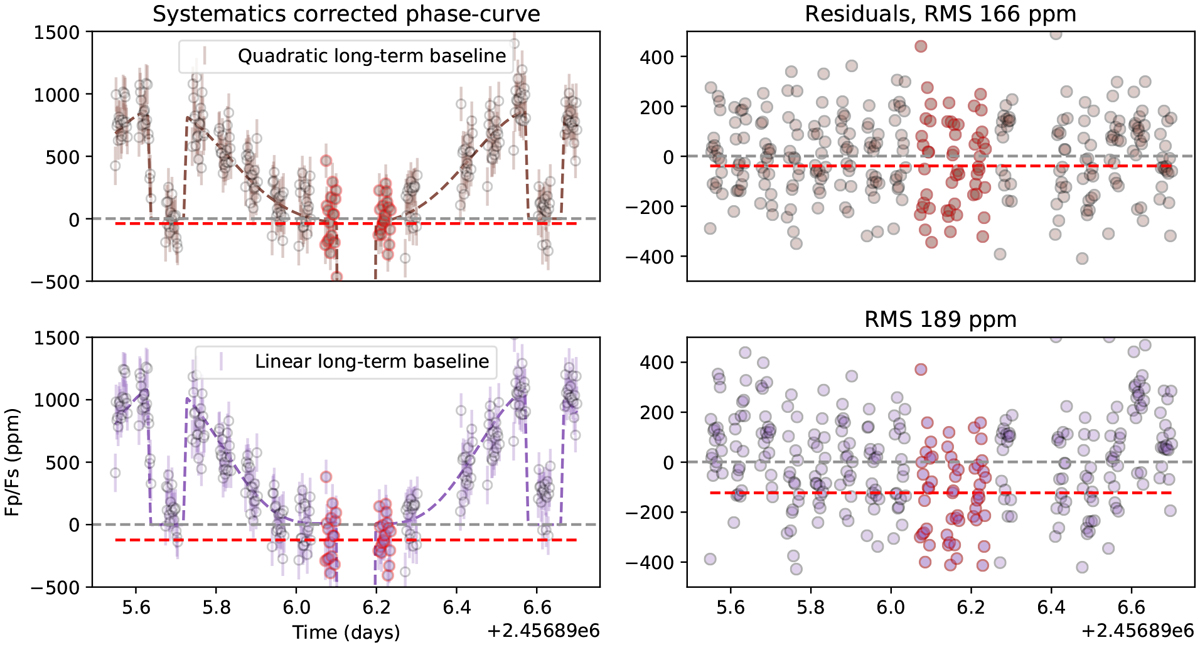
Effect of systematic, long-term slope model on extracted phase curve. Left panels: systematics corrected phase curve and best-fit model for the wavelength bin 1.27–1.30 μm. Right panels: the same residuals plotted in time. The red line indicates the mean of the nightside residuals. In both panels, the exposures used to calculate the nightside residuals are outlined in red. Using a linear visit-long systematics model degrades the precision of the light curve, introduces visible systematics in the residuals, and results in a significant negative nightside flux.
Current usage metrics show cumulative count of Article Views (full-text article views including HTML views, PDF and ePub downloads, according to the available data) and Abstracts Views on Vision4Press platform.
Data correspond to usage on the plateform after 2015. The current usage metrics is available 48-96 hours after online publication and is updated daily on week days.
Initial download of the metrics may take a while.