Fig. 1
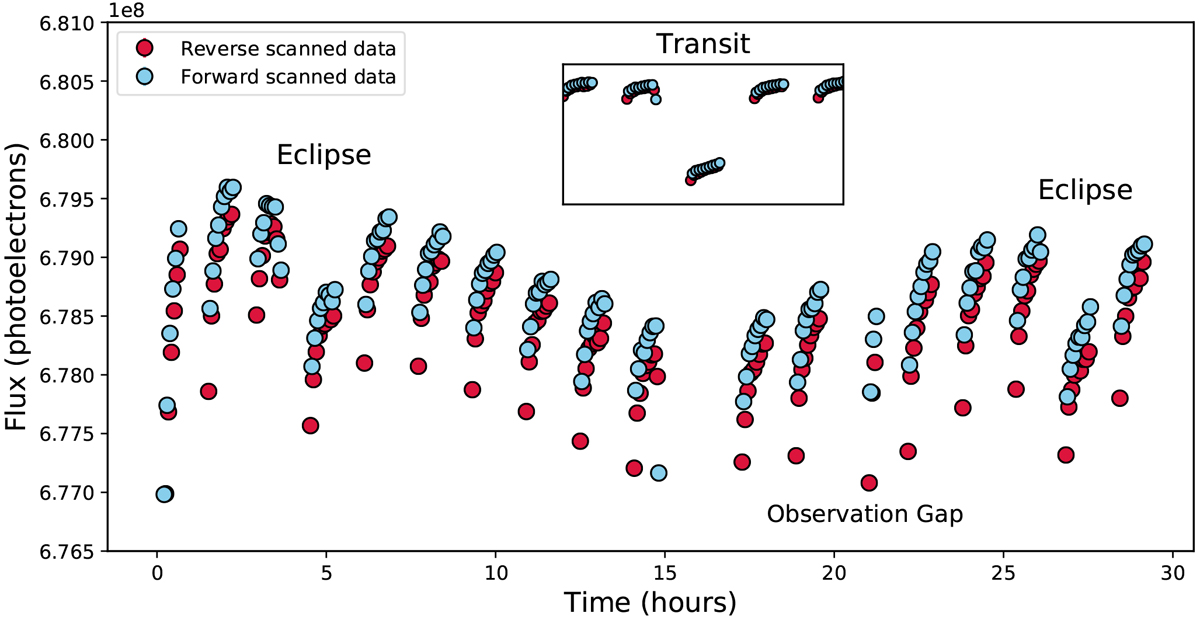
Raw observed phase curve of WASP-18b before removal of systematics and stellar variation. The transit is shown in the inset. The observations cover two eclipses to establish a baseline; there is one transit in the middle of the observations. There is an additional half-orbit gap in the observations at 20 h due to a gyro bias update. Clear orbit-long systematics can be seen, as well as a visit-long slope, on top of the phase-curve variation. The two colours signify the exposures taken from each of the two spatial scan directions, where there is an offset due to the fixed read-out pattern of the detector.
Current usage metrics show cumulative count of Article Views (full-text article views including HTML views, PDF and ePub downloads, according to the available data) and Abstracts Views on Vision4Press platform.
Data correspond to usage on the plateform after 2015. The current usage metrics is available 48-96 hours after online publication and is updated daily on week days.
Initial download of the metrics may take a while.