Fig. 5
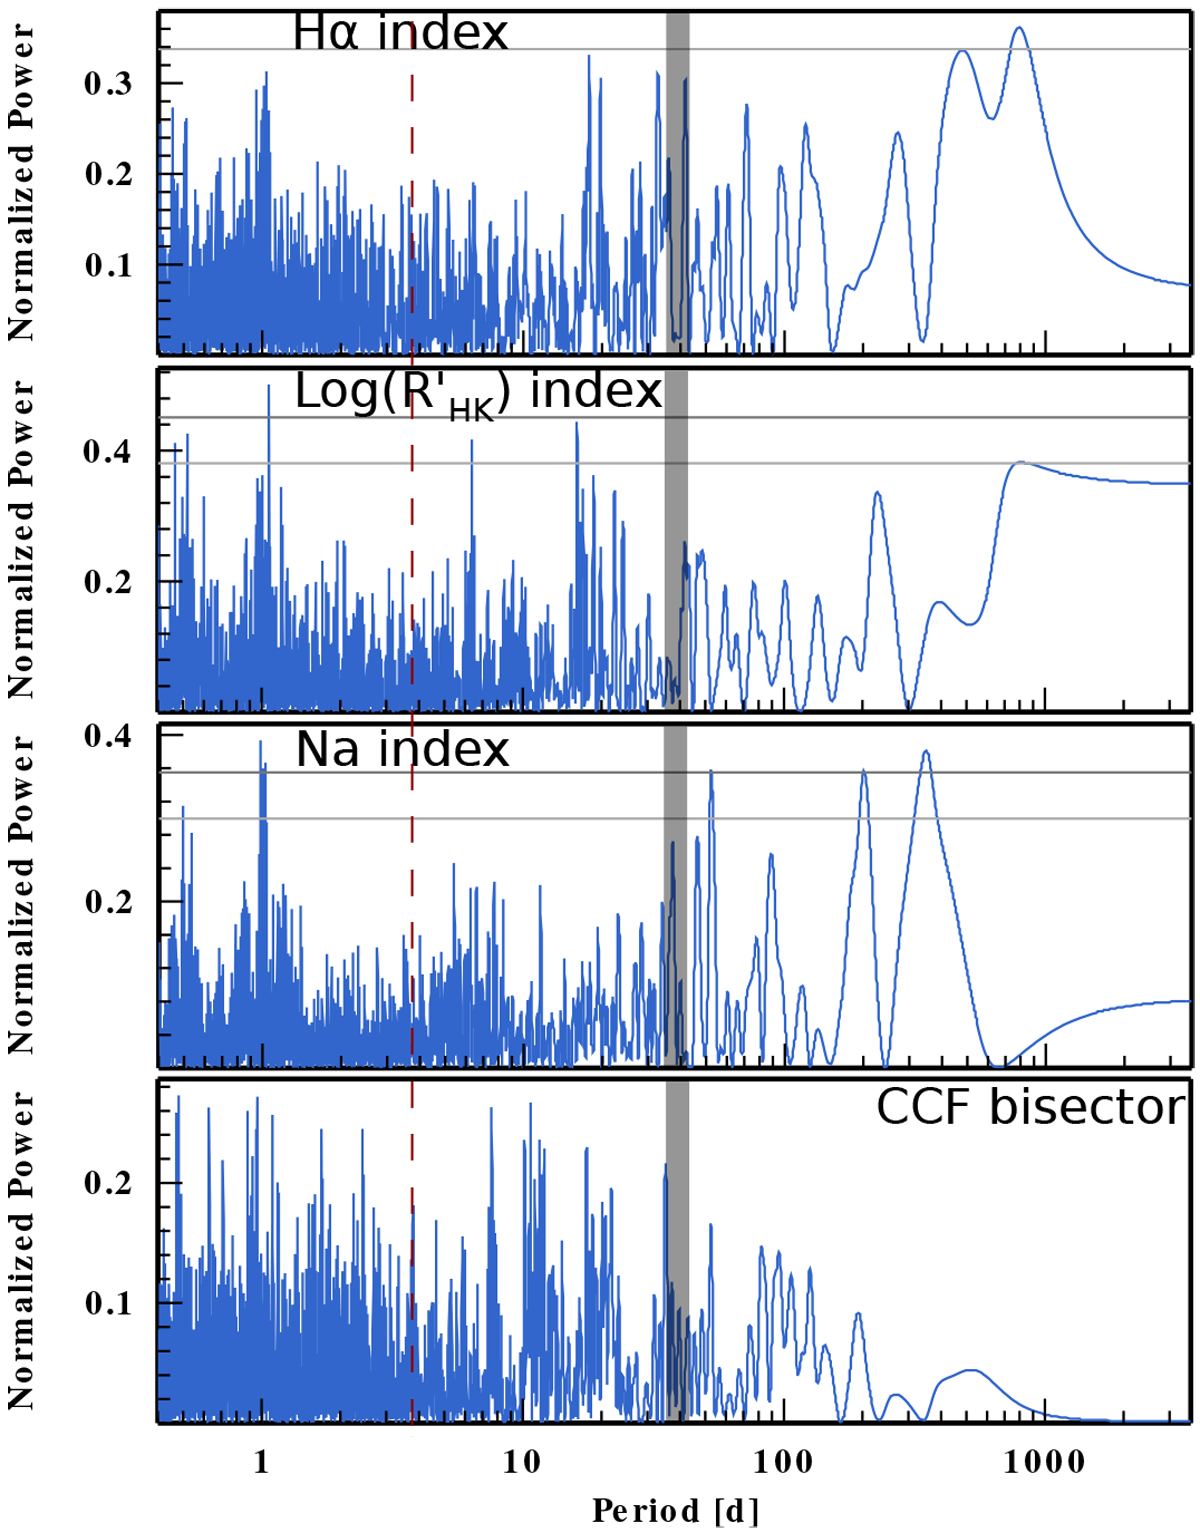
Periodogram of the activity indices for Gl 378. From top to bottom panels: Hα
index, log(![]() ) index, Na index, and CCF bisector. The horizontal lines indicate the 50 and 10% FAP levels. The red vertical dashed line marks the orbital period of Gl 378 b. The shaded grey region indicates the probable rotation period, as estimated from the log(
) index, Na index, and CCF bisector. The horizontal lines indicate the 50 and 10% FAP levels. The red vertical dashed line marks the orbital period of Gl 378 b. The shaded grey region indicates the probable rotation period, as estimated from the log(![]() ).
).
Current usage metrics show cumulative count of Article Views (full-text article views including HTML views, PDF and ePub downloads, according to the available data) and Abstracts Views on Vision4Press platform.
Data correspond to usage on the plateform after 2015. The current usage metrics is available 48-96 hours after online publication and is updated daily on week days.
Initial download of the metrics may take a while.