Open Access
Fig. 1
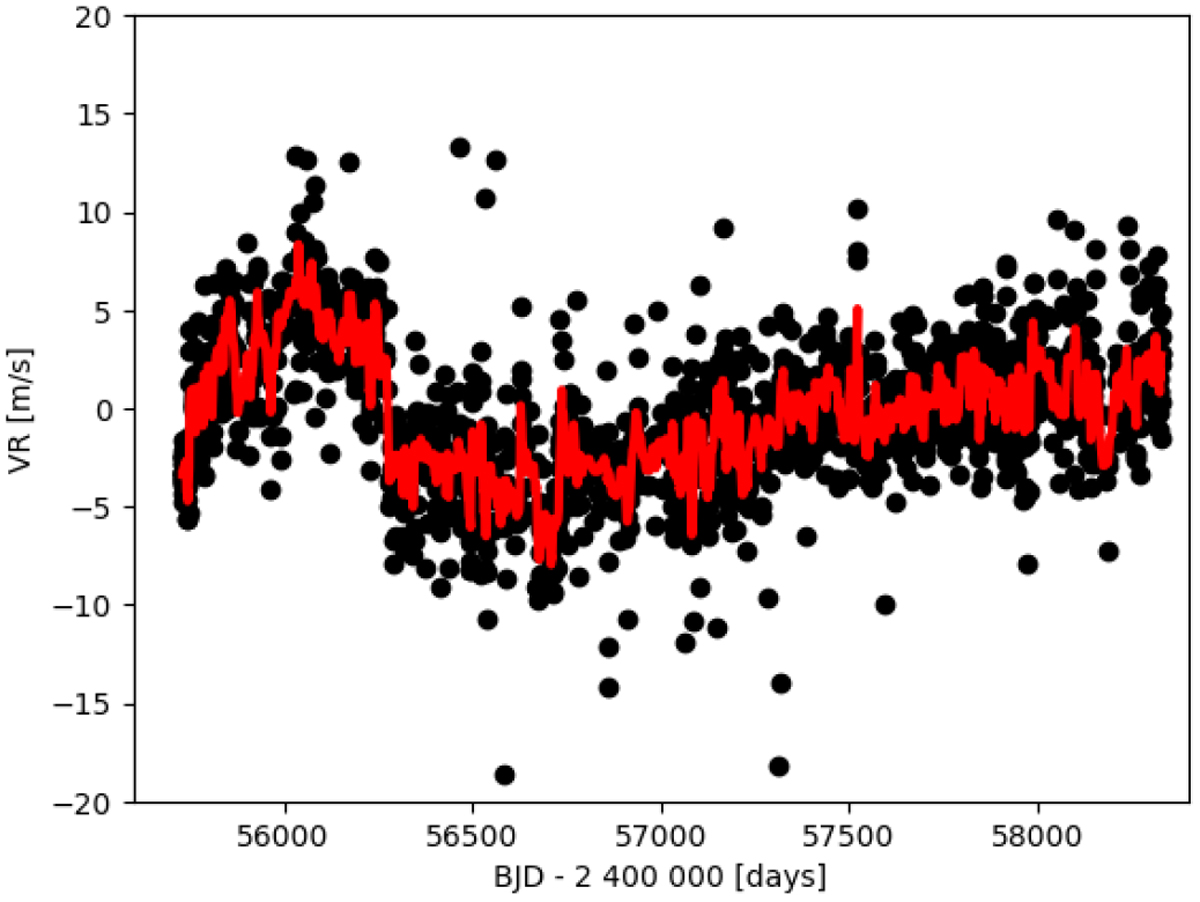
Correction for the long-term variations in the zero-point (red line) and the data points used to construct it (black dots). The points correspond to the ten stars detailed in Sect. 3. The correction spans 7 yr, with a dispersion of 2.87 m s−1 and a peak-to-peak variation of 16.3 m s−1.
Current usage metrics show cumulative count of Article Views (full-text article views including HTML views, PDF and ePub downloads, according to the available data) and Abstracts Views on Vision4Press platform.
Data correspond to usage on the plateform after 2015. The current usage metrics is available 48-96 hours after online publication and is updated daily on week days.
Initial download of the metrics may take a while.