Fig. 7.
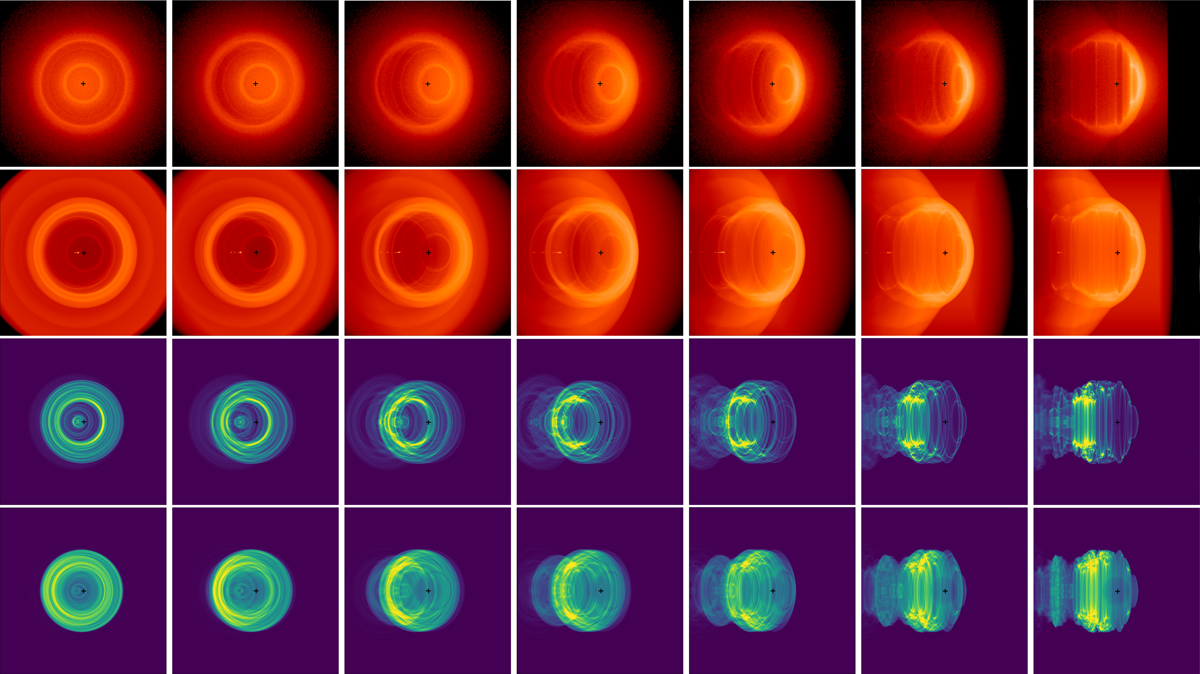
A snapshot (after 1 crossing time) from the 1b simulation was used to generate synthetic images of the Bubble Nebula at angles from 0°−90° with respect to the direction of stellar motion. First row: 24 μm emission, second row: Hα emission, third row: soft X-ray emission, and fourth row: hard X-ray emission. From left to right, the angles are 0°, 15°, 30°, 45°, 60°, 75°, and 90°. For the Hα and X-ray image we plot 1° and 89° instead of 0° and 90° because of technical limitations. Each image is centred on the star (black cross) and is roughly 5 × 5 parsec.
Current usage metrics show cumulative count of Article Views (full-text article views including HTML views, PDF and ePub downloads, according to the available data) and Abstracts Views on Vision4Press platform.
Data correspond to usage on the plateform after 2015. The current usage metrics is available 48-96 hours after online publication and is updated daily on week days.
Initial download of the metrics may take a while.